Nolan County, Texas
Nolan County is a county located in the west-central region of the U.S. state of Texas. As of the 2010 census, its population was 15,216.[1] Its county seat is Sweetwater.[2] The county was created in 1876 and organized in 1881.[3] It is named for Philip Nolan, one of the first American traders to visit Texas.
Nolan County | |
|---|---|
 Nolan County Courthouse | |
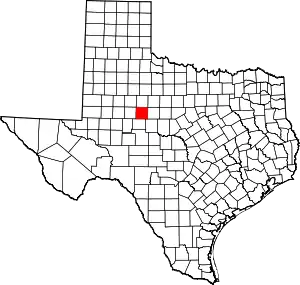 Location within the U.S. state of Texas | |
 Texas's location within the U.S. | |
| Coordinates: 32°19′N 100°24′W | |
| Country | |
| State | |
| Founded | 1881 |
| Named for | Philip Nolan |
| Seat | Sweetwater |
| Largest city | Sweetwater |
| Area | |
| • Total | 914 sq mi (2,370 km2) |
| • Land | 912 sq mi (2,360 km2) |
| • Water | 2.0 sq mi (5 km2) 0.2%% |
| Population (2010) | |
| • Total | 15,216 |
| • Density | 17/sq mi (7/km2) |
| Time zone | UTC−6 (Central) |
| • Summer (DST) | UTC−5 (CDT) |
| Congressional district | 19th |
| Website | www |
Nolan County comprises the Sweetwater, TX Micropolitan Statistical Area.
Susan King has been since 2007 the Republican state representative from Nolan, as well as Jones and Taylor Counties.[4]
From 1921 to 1925, the Democrat Richard M. Chitwood of Sweetwater represented Nolan County in the state House. As chairman of the House Education Committee, he worked in 1923 to establish what became Texas Tech University in Lubbock. He had first tried to obtain the institution for Sweetwater as the central location of West Texas. After the institution was established, he resigned from the House to move to Lubbock to become the first Texas Tech business manager. He served in that capacity for just 15 months; he died in Dallas in November 1926.[5]
Geography
According to the U.S. Census Bureau, the county has a total area of 914 square miles (2,370 km2), of which 912 square miles (2,360 km2) are land and 2.0 square miles (5.2 km2) (0.2%) are covered by water.[6]
Nolan County is in the Cross Timbers region for wildlife management.[7] Geologically Nolan County occupies part of the Rolling Plains in the North and South,[8] separated by an isolated part of the Edwards Plateau[9] in much of the center. The uplifted plateau, rising up to 500[10] feet above the surrounding plains, gives Nolan county an advantage on production of wind energy.
West of Highland School, the Bench Mountain at 2607 feet above sea level is listed as the highest point in Nolan County.
Plateau areas of the Cretaceous Period[11] and much of the county are underlain by petroleum deposits from the Pennsylvanian Period.[12]
Major highways
.svg.png.webp) Interstate 20
Interstate 20 U.S. Highway 84
 State Highway 70
 State Highway 153
Adjacent counties
- Fisher County (north)
- Taylor County (east)
- Runnels County (southeast)
- Coke County (south)
- Mitchell County (west)
Demographics
| Historical population | |||
|---|---|---|---|
| Census | Pop. | %± | |
| 1880 | 640 | — | |
| 1890 | 1,573 | 145.8% | |
| 1900 | 2,611 | 66.0% | |
| 1910 | 11,999 | 359.6% | |
| 1920 | 10,868 | −9.4% | |
| 1930 | 19,323 | 77.8% | |
| 1940 | 17,309 | −10.4% | |
| 1950 | 19,808 | 14.4% | |
| 1960 | 18,963 | −4.3% | |
| 1970 | 16,220 | −14.5% | |
| 1980 | 17,359 | 7.0% | |
| 1990 | 16,594 | −4.4% | |
| 2000 | 15,802 | −4.8% | |
| 2010 | 15,216 | −3.7% | |
| 2019 (est.) | 14,714 | [13] | −3.3% |
| U.S. Decennial Census[14] 1850–2010[15] 2010–2014[1] | |||
As of the census[16] of 2000, 15,802 people, 6,170 households, and 4,288 families resided in the county. The population density was 17 people per square mile (7/km2). The 7,112 housing units averaged 8 per square mile (3/km2). The racial makeup of the county was 78.45% White, 4.68% Black or African American, 0.49% Native American, 0.24% Asian, 0.06% Pacific Islander, 14.02% from other races, and 2.07% from two or more races. About 28.04% of the population was Hispanic or Latino of any race.
Of the 6,170 households, 32.20% had children under the age of 18 living with them, 53.00% were married couples living together, 12.60% had a female householder with no husband present, and 30.50% were not families. Around 27.10% of all households were made up of individuals, and 13.40% had someone living alone who was 65 years of age or older. The average household size was 2.48 and the average family size was 3.01.
In the county, the population was distributed as 27.10% under the age of 18, 8.50% from 18 to 24, 25.40% from 25 to 44, 22.60% from 45 to 64, and 16.40% who were 65 years of age or older. The median age was 37 years. For every 100 females, there were 94.70 males. For every 100 females age 18 and over, there were 91.70 males.
The median income for a household in the county was $26,209, and for a family was $32,004. Males had a median income of $28,674 versus $19,335 for females. The per capita income for the county was $14,077. About 18.30% of families and 21.70% of the population were below the poverty line, including 29.50% of those under age 18 and 18.50% of those age 65 or over.
Wind power
Nolan County has established itself as a center for wind power generation. As of July 2008, Nolan County generated more wind energy than the entire state of California, and would have ranked sixth in the world for wind power generation if it were counted as its own country.[17] In 2013, there were more than 13,000 operational wind turbines.[18]
A branch of Texas State Technical College operates near Sweetwater offering the first community college program for wind energy in Texas beginning in 2007.
Wind energy investments in the county of about $3 billion US dollars since 1999 have resulted in about 1,330 direct wind-related jobs which were created in Nolan County alone (in 2009), with almost $18,000,000 in annual landowner royalties and over $12,000,000 in annual local school taxes (2007),[19] and about $1.7 million more in county property taxes. The majority of investments come from Epplament Energy, E.ON, Invenergy, Lestis Private Capital Group, NextEra and Lattner Energy.
Nolan county is a hub of the Public Utility Commission's $5 Billion CREZ wind energy transmission line expansion project in Texas.[20]
Communities

Cities
- Blackwell (partly in Coke County)
- Roscoe
- Sweetwater (county seat)
Ghost towns
- Bitter Creek
- Wastella
- Decker ( active cemetery remaining )[22]
- Divide (Slater's Chapel cemetery[23] remaining)
Politics
| Year | Republican | Democratic | Third parties |
|---|---|---|---|
| 2020 | 77.1% 4,131 | 21.7% 1,162 | 1.2% 64 |
| 2016 | 73.1% 3,552 | 21.2% 1,029 | 5.7% 276 |
| 2012 | 71.7% 3,282 | 26.6% 1,216 | 1.7% 77 |
| 2008 | 68.8% 3,485 | 30.0% 1,521 | 1.1% 57 |
| 2004 | 70.4% 3,722 | 29.1% 1,541 | 0.5% 26 |
| 2000 | 62.8% 3,337 | 35.3% 1,874 | 1.9% 101 |
| 1996 | 40.2% 2,166 | 47.9% 2,582 | 11.9% 643 |
| 1992 | 33.5% 1,993 | 41.8% 2,490 | 24.7% 1,469 |
| 1988 | 48.7% 2,734 | 50.9% 2,853 | 0.4% 22 |
| 1984 | 58.8% 3,608 | 41.1% 2,524 | 0.1% 4 |
| 1980 | 48.8% 2,781 | 49.1% 2,796 | 2.1% 118 |
| 1976 | 43.8% 2,431 | 55.8% 3,094 | 0.4% 20 |
| 1972 | 73.0% 3,634 | 26.9% 1,338 | 0.1% 4 |
| 1968 | 33.2% 1,969 | 46.9% 2,784 | 20.0% 1,185 |
| 1964 | 31.2% 1,610 | 68.6% 3,540 | 0.2% 12 |
| 1960 | 42.7% 2,421 | 57.2% 3,247 | 0.1% 7 |
| 1956 | 46.7% 2,232 | 53.0% 2,535 | 0.3% 13 |
| 1952 | 48.1% 2,907 | 51.7% 3,123 | 0.2% 13 |
| 1948 | 13.6% 552 | 83.8% 3,408 | 2.7% 109 |
| 1944 | 8.6% 322 | 82.0% 3,071 | 9.5% 354 |
| 1940 | 12.4% 471 | 87.4% 3,314 | 0.2% 9 |
| 1936 | 8.4% 268 | 91.2% 2,913 | 0.5% 15 |
| 1932 | 8.2% 219 | 91.7% 2,453 | 0.1% 3 |
| 1928 | 58.8% 1,475 | 41.2% 1,035 | |
| 1924 | 18.3% 337 | 77.2% 1,421 | 4.5% 82 |
| 1920 | 15.2% 175 | 80.0% 923 | 4.9% 56 |
| 1916 | 7.5% 91 | 86.0% 1,048 | 6.6% 80 |
| 1912 | 7.3% 60 | 80.2% 655 | 12.5% 102 |
See also
References
- "State & County QuickFacts". United States Census Bureau. Archived from the original on October 18, 2011. Retrieved December 22, 2013.
- "Find a County". National Association of Counties. Retrieved 2011-06-07.
- "Texas: Individual County Chronologies". Texas Atlas of Historical County Boundaries. The Newberry Library. 2008. Retrieved May 25, 2015.
- "Susan King". Texas Legislative Reference Library. Retrieved March 12, 2014.
- "Richard M. Chitwood". Texas Legislative Reference Library. Retrieved July 31, 2015.
- "2010 Census Gazetteer Files". United States Census Bureau. August 22, 2012. Retrieved May 5, 2015.
- Cross Timbers https://tpwd.texas.gov/landwater/land/habitats/cross_timbers/regulatory/ accessed 11/8/2018
- Rolling Plains https://tpwd.texas.gov/landwater/land/habitats/cross_timbers/ecoregions/ accesses 11/8/2018
- Edwards Plateau https://tpwd.texas.gov/landwater/land/habitats/cross_timbers/ecoregions/edwards_plateau.phtml accessed 11/8/2018
- Elevation http://elevation.maplogs.com/poi/texas_usa.11015.html accessed 11/8/2018
- Cretaceous Period https://tpwd.texas.gov/landwater/land/habitats/cross_timbers/ecoregions/edwards_plateau.phtml accessed 11/8/22018
- Petroleum http://www.searchanddiscovery.com/abstracts/html/1987/sw/abstracts/0241.htm accessed 11/8/2018
- "Population and Housing Unit Estimates". United States Census Bureau. May 24, 2020. Retrieved May 27, 2020.
- "U.S. Decennial Census". United States Census Bureau. Retrieved May 5, 2015.
- "Texas Almanac: Population History of Counties from 1850–2010" (PDF). Texas Almanac. Retrieved May 5, 2015.
- "U.S. Census website". United States Census Bureau. Retrieved 2011-05-14.
- Reed, Dan (11 July 2008). "Texas oilman T. Boone Pickens wants to supplant oil with wind". USA Today.
- Selcraig, Bruce (July–August 2014). "The Mayor of Wind". Sierra Club. Retrieved 2020-07-02.
- Wind Economics In Nolan County https://www.scribd.com/doc/280240711/nolan-county-case-study-070908 accessed 11/19/2018
- Transmission Line Investment https://sweetwatertexas.net/windpower accessed 11/19/2018
- TSHA, Support. "Hylton TX (Nolan County)". TSHA Online. TSHA. Retrieved 3 February 2020.
- Ghost Town https://tshaonline.org/handbook/online/articles/hvd13 accessed 11/19/2018
- TSHA, Support. "Divide TX (Nolan County)". TSHA Online. TSHA. Retrieved 3 February 2020.
- Leip, David. "Dave Leip's Atlas of U.S. Presidential Elections". uselectionatlas.org. Retrieved 2018-07-28.
External links
- Nolan County Official Site
- Nolan County from the Handbook of Texas Online
- Nolan County Profile from the Texas Association of Counties
- The National WASP WWII Museum
Places adjacent to Nolan County, Texas | ||||||||||
|---|---|---|---|---|---|---|---|---|---|---|
| ||||||||||
Municipalities and communities of Nolan County, Texas, United States | ||
|---|---|---|
| Cities | Nolan County map | |
| Unincorporated communities | ||
| Ghost towns | ||
| Footnotes | ‡This populated place also has portions in an adjacent county or counties | |
| ||

| Wind power | ||
|---|---|---|
| Wind farms | ||
| Wind turbines | ||
| Wind power industry | ||
| Manufacturers | ||
| Concepts |
| |
| ||
| Authority control |
|---|