Jones County, Texas
Jones County is a county located in the U.S. state of Texas. As of the 2010 census, its population was 20,202.[1] Its county seat is Anson.[2] The county was created in 1858 and organized in 1881.[3] Both the county and its county seat are named for Anson Jones, the fifth president of the Republic of Texas.[4]
Jones County | |
|---|---|
 Jones County Courthouse in Anson, Texas | |
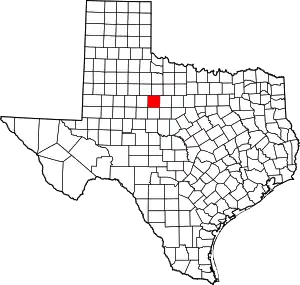 Location within the U.S. state of Texas | |
 Texas's location within the U.S. | |
| Coordinates: 32°44′N 99°53′W | |
| Country | |
| State | |
| Founded | 1881 |
| Named for | Anson Jones |
| Seat | Anson |
| Largest city | Stamford |
| Area | |
| • Total | 937.1 sq mi (2,427 km2) |
| • Land | 928.6 sq mi (2,405 km2) |
| • Water | 8.6 sq mi (22 km2) 0.9%% |
| Population (2010) | |
| • Total | 20,202 |
| • Density | 22/sq mi (8/km2) |
| Time zone | UTC−6 (Central) |
| • Summer (DST) | UTC−5 (CDT) |
| Congressional district | 19th |
| Website | www |
Jones County is included in the Abilene, Texas, metropolitan statistical area.
Geography
According to the U.S. Census Bureau, the county has a total area of 937 square miles (2,430 km2), of which 929 square miles (2,410 km2) are land and 8.6 square miles (22 km2) (0.9%) are covered by water.[5]
Major highways
 U.S. Highway 83
 U.S. Highway 180
 U.S. Highway 277
 State Highway 6
 State Highway 92
Adjacent counties
- Haskell County (north)
- Shackelford County (east)
- Callahan County (southeast)
- Taylor County (south)
- Fisher County (west)
- Stonewall County (northwest)
Demographics
| Historical population | |||
|---|---|---|---|
| Census | Pop. | %± | |
| 1880 | 546 | — | |
| 1890 | 3,797 | 595.4% | |
| 1900 | 7,053 | 85.8% | |
| 1910 | 24,299 | 244.5% | |
| 1920 | 22,323 | −8.1% | |
| 1930 | 24,233 | 8.6% | |
| 1940 | 23,378 | −3.5% | |
| 1950 | 22,147 | −5.3% | |
| 1960 | 19,299 | −12.9% | |
| 1970 | 16,106 | −16.5% | |
| 1980 | 17,268 | 7.2% | |
| 1990 | 16,490 | −4.5% | |
| 2000 | 20,785 | 26.0% | |
| 2010 | 20,202 | −2.8% | |
| 2019 (est.) | 20,083 | [6] | −0.6% |
| U.S. Decennial Census[7] 1850–2010[8] 2010–2014[1] | |||
As of the census[9] of 2000, 20,785 people, 6,140 households, and 4,525 families resided in the county. The population density was 22 people per square mile (9/km2). The 7,236 housing units averaged 8 per mi2 (3/km2). The racial makeup of the county was 78.80% White, 11.51% Black or African American, 0.49% Native American, 0.47% Asian, 7.47% from other races, and 1.27% from two or more races. About 20.9% of the population was Hispanic or Latino of any race.
Of the 6,140 households, 33.40% had children under the age of 18 living with them, 59.60% were married couples living together, 10.10% had a female householder with no husband present, and 26.30% were not families. About 24.1% of all households were made up of individuals, and 13.40% had someone living alone who was 65 years of age or older. The average household size was 2.58 and the average family size was 3.06.
In the county, theage distribution was 22.50% under 18, 11.10% from 18 to 24, 31.50% from 25 to 44, 21.00% from 45 to 64, and 14.00% who were 65 or older. The median age was 36 years. For every 100 females, there were 150.10 males. For every 100 females age 18 and over, there were 159.70 males.
The median income for a household in the county was $29,572, and for a family was $35,391. Males had a median income of $26,892 versus $17,829 for females. The per capita income for the county was $13,656. About 13.10% of families and 16.80% of the population were below the poverty line, including 22.70% of those under age 18 and 16.60% of those age 65 or over.
Government and infrastructure
The Texas Department of Criminal Justice (TDCJ) operates the Robertson Unit prison, located 10 miles from downtown.[10] The state Middleton Unit transfer unit is located partially in Abilene and also in Jones County.[11][12]
Since 2007 Republican Susan King has represented Jones, Nolan, and Taylor Counties in the state house.[13]
Politics
Until 2000, Jones County presidential politics were dominated by white conservative members of the Democratic Party, with a political history typical of the Solid South. Racial minorities had been largely disenfranchised from the turn of the 20th century, well into the late 1960s, by laws that discriminated against them and made voter registration and voting more difficult. Such laws included those allowing the Democratic Party to have white primaries; this practice ended with the US Supreme Court case known as Smith v. Allwright (1944), which declared the practice racially discriminatory and unconstitutional.[14][15]
The majority of voters in the county, who were generally white conservative Democrats, supported Republican presidential candidates only five times from 1912 to 1996. Through the late 20th century, white conservatives shifted into the Republican Party, while minority ethnic groups largely aligned with the Democratic Party, which had supposedly supported their campaigns for civil rights. Some Republican candidates also began to win local and state offices.
Since 2000, the majority of voters selected Republican presidential candidates, with the margin of victory for the party's candidates increasing in each election.
| Year | Republican | Democratic | Third parties |
|---|---|---|---|
| 2016 | 80.9% 4,819 | 15.7% 936 | 3.4% 205 |
| 2012 | 76.6% 4,262 | 22.0% 1,226 | 1.4% 79 |
| 2008 | 72.4% 4,203 | 26.3% 1,528 | 1.3% 77 |
| 2004 | 71.7% 4,254 | 28.0% 1,658 | 0.3% 19 |
| 2000 | 67.5% 4,080 | 31.4% 1,899 | 1.1% 69 |
| 1996 | 43.5% 2,351 | 44.8% 2,422 | 11.8% 637 |
| 1992 | 35.2% 2,088 | 40.5% 2,400 | 24.3% 1,444 |
| 1988 | 50.7% 3,000 | 49.0% 2,898 | 0.3% 18 |
| 1984 | 62.9% 4,017 | 36.7% 2,343 | 0.4% 23 |
| 1980 | 47.1% 2,765 | 51.8% 3,043 | 1.1% 66 |
| 1976 | 38.3% 2,072 | 61.3% 3,318 | 0.5% 26 |
| 1972 | 75.1% 3,202 | 24.6% 1,050 | 0.3% 11 |
| 1968 | 33.7% 1,676 | 47.6% 2,372 | 18.7% 931 |
| 1964 | 26.3% 1,295 | 73.6% 3,622 | 0.1% 3 |
| 1960 | 44.0% 2,196 | 55.6% 2,772 | 0.4% 18 |
| 1956 | 44.3% 2,073 | 55.5% 2,594 | 0.2% 10 |
| 1952 | 52.2% 2,941 | 47.6% 2,680 | 0.2% 12 |
| 1948 | 10.3% 432 | 86.2% 3,599 | 3.5% 146 |
| 1944 | 8.8% 361 | 83.0% 3,417 | 8.2% 339 |
| 1940 | 9.8% 401 | 90.1% 3,688 | 0.1% 5 |
| 1936 | 8.2% 305 | 91.7% 3,396 | 0.1% 2 |
| 1932 | 7.0% 224 | 92.0% 2,934 | 0.9% 30 |
| 1928 | 56.0% 1,995 | 43.8% 1,563 | 0.2% 8 |
| 1924 | 15.4% 566 | 81.9% 3,010 | 2.8% 101 |
| 1920 | 11.8% 270 | 78.5% 1,792 | 9.6% 220 |
| 1916 | 5.3% 114 | 84.2% 1,798 | 10.5% 224 |
| 1912 | 3.9% 63 | 80.4% 1,301 | 15.8% 255 |
Communities
Cities
- Abilene (mostly in Taylor County)
- Anson (county seat)
- Hamlin (small part in Fisher County)
- Hawley
- Lueders (small part in Shackelford County)
- Stamford (mostly in Haskell County)
Notable residents
- Charles Stenholm, former member of the United States House of Representatives
See also
References
- "State & County QuickFacts". United States Census Bureau. Archived from the original on May 18, 2011. Retrieved December 18, 2013.
- "Find a County". National Association of Counties. Archived from the original on 2011-05-31. Retrieved 2011-06-07.
- "Texas: Individual County Chronologies". Texas Atlas of Historical County Boundaries. The Newberry Library. 2008. Retrieved May 24, 2015.
- Gannett, Henry (1905). The Origin of Certain Place Names in the United States. Govt. Print. Off. pp. 170.
- "2010 Census Gazetteer Files". United States Census Bureau. August 22, 2012. Retrieved May 2, 2015.
- "Population and Housing Unit Estimates". United States Census Bureau. May 24, 2020. Retrieved May 27, 2020.
- "U.S. Decennial Census". United States Census Bureau. Retrieved May 2, 2015.
- "Texas Almanac: Population History of Counties from 1850–2010" (PDF). Texas Almanac. Retrieved May 2, 2015.
- "U.S. Census website". United States Census Bureau. Retrieved 2011-05-14.
- "Robertson Unit Archived 2010-07-25 at the Wayback Machine." Texas Department of Criminal Justice. Retrieved on July 23, 2010.
- "Super Neighborhood Areas Archived 2011-06-09 at the Wayback Machine." (Direct map link Archived 2011-06-09 at the Wayback Machine) City of Abilene. Retrieved on July 23, 2010.
- "Middleton Unit Archived 2010-07-25 at the Wayback Machine." Texas Department of Criminal Justice. Retrieved on July 23, 2010.
- "Susan King". Texas Legislative Reference Library. Retrieved March 12, 2014.
- "White Primary", American Radio Works
- Williams, Patrick G. “Suffrage Restriction in Post-Reconstruction Texas: Urban Politics and the Specter of the Commune.” The Journal of Southern History, vol. 68, no. 1, 2002, pp. 31–64. JSTOR, www.jstor.org/stable/3069690. Accessed 6 Sept. 2020
- Leip, David. "Dave Leip's Atlas of U.S. Presidential Elections". uselectionatlas.org. Retrieved 11 April 2018.
External links
| Wikimedia Commons has media related to Jones County, Texas. |
- Jones County government's website
- Jones County from the Handbook of Texas Online
- Jones County Profile from the Texas Association of Counties
Places adjacent to Jones County, Texas | ||||||||||
|---|---|---|---|---|---|---|---|---|---|---|
| ||||||||||
Municipalities and communities of Jones County, Texas, United States | ||
|---|---|---|
| Cities | Jones County map | |
| Unincorporated communities | ||
| Footnotes | ‡This populated place also has portions in an adjacent county or counties | |
| ||
