Hockley County, Texas
Hockley County is a county located in the U.S. state of Texas. As of the 2010 census, its population was 22,935.[1] Its county seat is Levelland.[2] The county was created in 1876, but not organized until 1921.[3] It is named for George Washington Hockley, a secretary of war of the Republic of Texas.
Hockley County | |
|---|---|
 The Hockley County Courthouse in Levelland | |
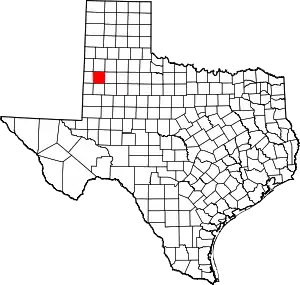 Location within the U.S. state of Texas | |
 Texas's location within the U.S. | |
| Coordinates: 33°37′N 102°20′W | |
| Country | |
| State | |
| Founded | 1921 |
| Named for | George Washington Hockley |
| Seat | Levelland |
| Largest city | Levelland |
| Area | |
| • Total | 909 sq mi (2,350 km2) |
| • Land | 908 sq mi (2,350 km2) |
| • Water | 0.2 sq mi (0.5 km2) 0.02%% |
| Population (2010) | |
| • Total | 22,935 |
| • Density | 25/sq mi (10/km2) |
| Time zone | UTC−6 (Central) |
| • Summer (DST) | UTC−5 (CDT) |
| Congressional district | 19th |
| Website | www |
Hockley County comprises the Levelland Micropolitan Statistical Area, which is included in the Lubbock–Levelland Combined Statistical Area.
History
Hockley County was formed in 1876 from portions of Bexar and Young Counties. It was named for George Washington Hockley,[4] the commander of artillery in the Battle of San Jacinto and later Secretary of War of the Republic of Texas.
Geography
According to the U.S. Census Bureau, the county has a total area of 909 square miles (2,350 km2), of which 908 square miles (2,350 km2) are land and 0.2 sq mi (0.52 km2) (0.02%) is covered by water.[5]
Major highways

 U.S. Highway 62/U.S. Highway 82
 U.S. Highway 84
 U.S. Highway 385
 State Highway 114
Adjacent counties
- Lamb County (north)
- Lubbock County (east)
- Terry County (south)
- Cochran County (west)
- Yoakum County (southwest)
- Bailey County (northwest)
- Hale County (northeast)
- Lynn County (southeast)
Demographics
| Historical population | |||
|---|---|---|---|
| Census | Pop. | %± | |
| 1900 | 44 | — | |
| 1910 | 137 | 211.4% | |
| 1920 | 137 | 0.0% | |
| 1930 | 9,298 | 6,686.9% | |
| 1940 | 12,693 | 36.5% | |
| 1950 | 20,407 | 60.8% | |
| 1960 | 22,340 | 9.5% | |
| 1970 | 20,396 | −8.7% | |
| 1980 | 23,230 | 13.9% | |
| 1990 | 24,199 | 4.2% | |
| 2000 | 22,716 | −6.1% | |
| 2010 | 22,935 | 1.0% | |
| 2019 (est.) | 23,021 | [6] | 0.4% |
| U.S. Decennial Census[7] 1850–2010[8] 2010–2014[1] | |||
As of the census[9] of 2000, 22,716 people, 7,994 households, and 6,091 families resided in the county. The population density was 25 people per square mile (10/km2). The 9,148 housing units averaged 10 per square mile (4/km2). The racial makeup of the county was 74.38% White, 3.72% Black or African American, 0.82% Native American, 0.13% Asian, 0.04% Pacific Islander, 18.68% from other races, and 2.22% from two or more races. About 37.24% of the population was Hispanic or Latino of any race.
Of the 7,994 households, 38.10% had children under the age of 18 living with them, 60.40% were married couples living together, 11.50% had a female householder with no husband present, and 23.80% were not families, and 21.20% of all households were made up of individuals, and 10.00% had someone living alone who was 65 years of age or older. The average household size was 2.77 and the average family size was 3.22.
In the county, the population was distributed as 29.10% under the age of 18, 11.80% from 18 to 24, 25.90% from 25 to 44, 20.60% from 45 to 64, and 12.60% who were 65 years of age or older. The median age was 33 years. For every 100 females, there were 96.30 males. For every 100 females age 18 and over, there were 92.20 males.
The median income for a household in the county was $31,085, and for a family was $35,288. Males had a median income of $29,735 versus $20,671 for females. The per capita income for the county was $15,022. About 14.80% of families and 18.90% of the population were below the poverty line, including 24.10% of those under age 18 and 12.60% of those age 65 or over.
Communities
Cities
- Anton
- Levelland (county seat)
- Ropesville
Towns
Unincorporated communities
- Oklahoma Flat
- Pep
- Pettit
- Roundup
- Whitharral
Politics
| Year | Republican | Democratic | Third parties |
|---|---|---|---|
| 2020 | 80.7% 6,536 | 18.3% 1,482 | 1.0% 82 |
| 2016 | 79.5% 5,809 | 17.2% 1,260 | 3.3% 242 |
| 2012 | 77.7% 5,546 | 20.8% 1,486 | 1.4% 102 |
| 2008 | 75.8% 5,795 | 23.5% 1,797 | 0.7% 53 |
| 2004 | 81.3% 6,160 | 18.3% 1,385 | 0.4% 32 |
| 2000 | 77.8% 5,250 | 21.0% 1,419 | 1.1% 76 |
| 1996 | 60.9% 4,230 | 31.2% 2,170 | 7.9% 550 |
| 1992 | 54.2% 4,261 | 29.3% 2,301 | 16.6% 1,306 |
| 1988 | 60.3% 4,368 | 39.3% 2,850 | 0.4% 32 |
| 1984 | 72.4% 5,462 | 27.1% 2,044 | 0.5% 39 |
| 1980 | 64.0% 4,599 | 34.1% 2,447 | 1.9% 137 |
| 1976 | 44.0% 3,137 | 55.4% 3,949 | 0.6% 44 |
| 1972 | 70.8% 4,084 | 28.2% 1,625 | 1.0% 56 |
| 1968 | 36.9% 2,265 | 39.5% 2,426 | 23.7% 1,456 |
| 1964 | 29.2% 1,674 | 70.6% 4,049 | 0.2% 10 |
| 1960 | 40.3% 2,159 | 59.2% 3,169 | 0.6% 30 |
| 1956 | 38.6% 2,001 | 61.2% 3,175 | 0.2% 10 |
| 1952 | 47.2% 2,651 | 52.7% 2,962 | 0.1% 7 |
| 1948 | 9.5% 346 | 84.6% 3,071 | 5.9% 214 |
| 1944 | 9.5% 319 | 78.4% 2,641 | 12.1% 407 |
| 1940 | 9.9% 261 | 89.9% 2,382 | 0.2% 6 |
| 1936 | 4.9% 90 | 94.4% 1,731 | 0.7% 12 |
| 1932 | 4.7% 76 | 93.2% 1,513 | 2.1% 34 |
| 1928 | 75.8% 765 | 23.3% 235 | 0.9% 9 |
| 1924 | 21.3% 20 | 73.4% 69 | 5.3% 5 |
See also
References
- "State & County QuickFacts". United States Census Bureau. Archived from the original on October 18, 2011. Retrieved December 17, 2013.
- "Find a County". National Association of Counties. Archived from the original on 2011-05-31. Retrieved 2011-06-07.
- "Texas: Individual County Chronologies". Texas Atlas of Historical County Boundaries. The Newberry Library. 2008. Retrieved May 24, 2015.
- Gannett, Henry (1905). The Origin of Certain Place Names in the United States. Govt. Print. Off. pp. 158.
- "2010 Census Gazetteer Files". United States Census Bureau. August 22, 2012. Retrieved April 30, 2015.
- "Population and Housing Unit Estimates". United States Census Bureau. May 24, 2020. Retrieved May 27, 2020.
- "U.S. Decennial Census". United States Census Bureau. Retrieved April 30, 2015.
- "Texas Almanac: Population History of Counties from 1850–2010" (PDF). Texas Almanac. Retrieved April 30, 2015.
- "U.S. Census website". United States Census Bureau. Retrieved 2011-05-14.
- Leip, David. "Dave Leip's Atlas of U.S. Presidential Elections". uselectionatlas.org. Retrieved 2018-07-25.
External links
| Wikimedia Commons has media related to Hockley County, Texas. |
- Hockley County from the Handbook of Texas Online
- Hockley County Profile from the Texas Association of Counties
- Photos of West Texas and the Llano Estacado
Places adjacent to Hockley County, Texas | ||||||||||
|---|---|---|---|---|---|---|---|---|---|---|
| ||||||||||
Municipalities and communities of Hockley County, Texas, United States | ||
|---|---|---|
| Cities | Hockley County map | |
| Towns | ||
| Unincorporated communities | ||
| ||

| Authority control |
|---|