Callahan County, Texas
Callahan County is a county located in the U.S. state of Texas. As of the 2010 census, the population was 13,544.[1] Its county seat is Baird.[2] The county was founded in 1858 and later organized in 1877.[3] It is named for James Hughes Callahan, an American soldier in the Texas Revolution.
Callahan County | |
|---|---|
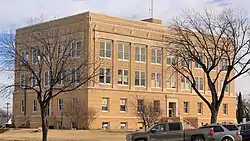 Callahan County Courthouse in Baird | |
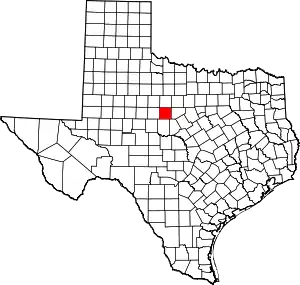 Location within the U.S. state of Texas | |
 Texas's location within the U.S. | |
| Coordinates: 32°17′N 99°22′W | |
| Country | |
| State | |
| Founded | 1877 |
| Seat | Baird |
| Largest city | Clyde |
| Area | |
| • Total | 901.3 sq mi (2,334 km2) |
| • Land | 899.4 sq mi (2,329 km2) |
| • Water | 1.9 sq mi (5 km2) 0.2%% |
| Population (2010) | |
| • Total | 13,544 |
| • Density | 15/sq mi (6/km2) |
| Time zone | UTC−6 (Central) |
| • Summer (DST) | UTC−5 (CDT) |
| Congressional district | 11th |
| Website | www |
Callahan County is included in the Abilene, Texas metropolitan statistical area.
Geography
According to the U.S. Census Bureau, the county has a total area of 901 square miles (2,330 km2), of which 899 sq mi (2,330 km2) are land and 1.9 sq mi (4.9 km2) (0.2%) are covered by water.[4]
Callahan Divide is range of hills that extends 26 miles from west to southeast through Taylor and Callahan Counties, with highest elevation 2411 ft, which together with other elevated areas in the two counties provide advantages in wind energy.
Major highways
.svg.png.webp) Interstate 20
Interstate 20 U.S. Highway 283
 State Highway 36
 State Highway 206
 State Highway 351
Adjacent counties
- Shackelford County (north)
- Eastland County (east)
- Brown County (southeast)
- Coleman County (south)
- Taylor County (west)
- Jones County (northwest)
Demographics
| Historical population | |||
|---|---|---|---|
| Census | Pop. | %± | |
| 1880 | 3,453 | — | |
| 1890 | 5,457 | 58.0% | |
| 1900 | 8,768 | 60.7% | |
| 1910 | 12,973 | 48.0% | |
| 1920 | 11,844 | −8.7% | |
| 1930 | 12,785 | 7.9% | |
| 1940 | 11,568 | −9.5% | |
| 1950 | 9,087 | −21.4% | |
| 1960 | 7,929 | −12.7% | |
| 1970 | 8,205 | 3.5% | |
| 1980 | 10,992 | 34.0% | |
| 1990 | 11,859 | 7.9% | |
| 2000 | 12,905 | 8.8% | |
| 2010 | 13,544 | 5.0% | |
| 2019 (est.) | 13,943 | [5] | 2.9% |
| U.S. Decennial Census[6] 1850–2010[7] 2010–2014[1] | |||
Per the 2010 United States Census, Callahan County had 13,544 people. Among non-Hispanics, this includes 12,065 White (89.1%), 135 Black (1.0%), 56 Asian (0.4%), 61 Native American, 7 Pacific Islander, 10 from some other race, and 185 from two or more races. The Hispanic or Latino population included 1,025 people (7.6%).
Of the 5,447 households, 27.1% had children under the age of 18 living with them, 57.0% were married couples living together, 5.2% had a female householder with children and no husband present, and 28.5% were not families. About 24.7% of households were one person and 32.3% had someone who was 65 or older.
The age distribution was 76.2% over 18 and 18.2% 65 or older. The median age was 43.0 years. The gender ratio was 48.8% male and 51.2% female. Among 5,447 occupied households, 78.7% were owner-occupied and 21.3% were renter-occupied.
At the 2000 census, 12,905 people, 5,061 households, and 3,750 families were in the county. The population density was 14 people per square mile (6/km2). The 5,925 housing units averaged 7 /sq mi (3/km2). The racial makeup of the county was 94.78% White, 0.22% Black or African American, 0.63% Native American, 0.26% Asian, 0.05% Pacific Islander, 2.70% from other races, and 1.35% from two or more races. 6.29% of the population were Hispanic or Latino of any race.[8] Of the 5,061 households, 31.90% had children under the age of 18 living with them, 61.60% were married couples living together, 9.30% had a female householder with no husband present, and 25.90% were not families. About 23.30% of households were one person, and 12.20% were one person aged 65 or older. The average household size was 2.53, and the average family size was 2.97.
The age distribution was 26.20% under 18, 6.60% from 18 to 24, 24.90% from 25 to 44, 25.30% from 45 to 64, and 17.00% 65 or older. The median age was 40 years. For every 100 females, there were 94.40 males. For every 100 females age 18 and over, there were 90.90 males.
The median household income was $32,463 and the median family income was $37,165. Males had a median income of $27,086 versus $19,720 for females. The per capita income for the county was $15,204. About 9.00% of families and 12.20% of the population were below the poverty line, including 14.80% of those under age 18 and 9.80% of those age 65 or over.
Politics
| Year | Republican | Democratic | Third parties |
|---|---|---|---|
| 2020 | 88.0% 6,012 | 10.7% 734 | 1.3% 86 |
| 2016 | 87.2% 4,865 | 10.2% 569 | 2.6% 145 |
| 2012 | 84.2% 4,378 | 14.5% 751 | 1.3% 68 |
| 2008 | 80.3% 4,589 | 18.6% 1,063 | 1.1% 64 |
| 2004 | 80.3% 4,542 | 19.0% 1,073 | 0.7% 39 |
| 2000 | 74.7% 3,656 | 24.0% 1,174 | 1.3% 66 |
| 1996 | 52.8% 2,480 | 35.5% 1,666 | 11.7% 549 |
| 1992 | 40.4% 2,134 | 32.1% 1,694 | 27.6% 1,457 |
| 1988 | 58.7% 2,887 | 41.0% 2,017 | 0.4% 17 |
| 1984 | 72.7% 3,538 | 26.8% 1,305 | 0.5% 24 |
| 1980 | 52.7% 2,284 | 46.2% 2,002 | 1.0% 45 |
| 1976 | 40.9% 1,581 | 58.0% 2,241 | 1.1% 42 |
| 1972 | 75.6% 2,223 | 22.6% 665 | 1.7% 51 |
| 1968 | 29.8% 921 | 46.4% 1,437 | 23.8% 738 |
| 1964 | 28.0% 849 | 71.7% 2,178 | 0.3% 10 |
| 1960 | 44.4% 1,261 | 54.9% 1,559 | 0.6% 18 |
| 1956 | 48.5% 1,140 | 51.0% 1,199 | 0.6% 14 |
| 1952 | 48.7% 1,431 | 51.1% 1,502 | 0.2% 5 |
| 1948 | 11.7% 258 | 83.4% 1,844 | 4.9% 109 |
| 1944 | 9.1% 224 | 79.7% 1,962 | 11.3% 277 |
| 1940 | 11.8% 309 | 88.1% 2,310 | 0.2% 4 |
| 1936 | 12.3% 245 | 87.3% 1,739 | 0.4% 7 |
| 1932 | 6.7% 152 | 93.4% 2,133 | |
| 1928 | 51.0% 979 | 49.0% 940 | |
| 1924 | 12.5% 244 | 82.9% 1,614 | 4.5% 88 |
| 1920 | 17.7% 213 | 66.8% 804 | 15.5% 187 |
| 1916 | 6.6% 74 | 85.6% 959 | 7.9% 88 |
| 1912 | 5.1% 45 | 89.0% 782 | 5.9% 52 |
Communities
Towns
Unincorporated communities
- Cottonwood
- Eula
- Oplin
Ghost towns
- Belle Plain
- Callahan City
- Dudley
- Pueblo
See also
References
- "State & County QuickFacts". United States Census Bureau. Archived from the original on July 8, 2011. Retrieved December 9, 2013.
- "Find a County". National Association of Counties. Archived from the original on 2011-05-31. Retrieved 2011-06-07.
- "Texas: Individual County Chronologies". Texas Atlas of Historical County Boundaries. The Newberry Library. 2008. Retrieved May 21, 2015.
- "2010 Census Gazetteer Files". United States Census Bureau. August 22, 2012. Retrieved April 20, 2015.
- "Population and Housing Unit Estimates". United States Census Bureau. May 24, 2020. Retrieved May 27, 2020.
- "U.S. Decennial Census". United States Census Bureau. Retrieved April 20, 2015.
- "Texas Almanac: Population History of Counties from 1850–2010" (PDF). Texas Almanac. Retrieved April 20, 2015.
- "U.S. Census website". United States Census Bureau. Retrieved 2011-05-14.
- Leip, David. "Dave Leip's Atlas of U.S. Presidential Elections". uselectionatlas.org. Retrieved 2018-07-20.
External links
| Wikimedia Commons has media related to Callahan County, Texas. |
- Callahan County in Handbook of Texas Online at the University of Texas
- Callahan County Website
- Callahan County Profile from the Texas Association of Counties
Places adjacent to Callahan County, Texas | ||||||||||
|---|---|---|---|---|---|---|---|---|---|---|
| ||||||||||
Municipalities and communities of Callahan County, Texas, United States | ||
|---|---|---|
| Cities | Callahan County map | |
| Towns | ||
| Unincorporated communities | ||
| Ghost towns | ||
| ||

| Authority control |
|---|