Lipscomb County, Texas
Lipscomb County (/ˈlɪpskəm/ LIP-skəm) is a county located in the U.S. state of Texas. As of the 2010 census, its population was 3,302.[1] Its county seat is Lipscomb.[2] The county was created in 1876 and organized in 1887.[3] It is named for Judge Abner Smith Lipscomb, a secretary of state of the Republic of Texas.[4]
Lipscomb County | |
|---|---|
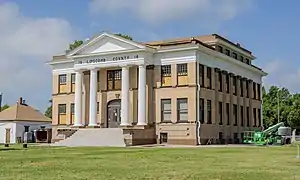 Lipscomb County courthouse in Lipscomb. Shown here undergoing restoration in May 2020. | |
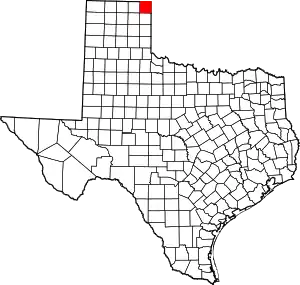 Location within the U.S. state of Texas | |
 Texas's location within the U.S. | |
| Coordinates: 36°17′N 100°16′W | |
| Country | |
| State | |
| Founded | 1887 |
| Named for | Abner Smith Lipscomb |
| Seat | Lipscomb |
| Largest town | Booker |
| Area | |
| • Total | 932 sq mi (2,410 km2) |
| • Land | 932 sq mi (2,410 km2) |
| • Water | 0.1 sq mi (0.3 km2) 0.01%% |
| Population | |
| • Estimate (2015) | 3,569 |
| • Density | 3.5/sq mi (1.4/km2) |
| Time zone | UTC−6 (Central) |
| • Summer (DST) | UTC−5 (CDT) |
| Congressional district | 13th |
| Website | www |
Geography
According to the U.S. Census Bureau, the county has a total area of 932 sq mi (2,410 km2), almost all of which are land and 0.1 sq mi (0.26 km2) (0.01%) is covered by water.[5]
Major highways
 U.S. Highway 60
 U.S. Highway 83
 State Highway 15
 State Highway 23
 State Highway 213
 State Highway 305
Adjacent counties
- Beaver County, Oklahoma (north)
- Ellis County, Oklahoma (east)
- Hemphill County (south)
- Roberts County (southwest)
- Ochiltree County (west)
Demographics
| Historical population | |||
|---|---|---|---|
| Census | Pop. | %± | |
| 1880 | 69 | — | |
| 1890 | 632 | 815.9% | |
| 1900 | 790 | 25.0% | |
| 1910 | 2,634 | 233.4% | |
| 1920 | 3,684 | 39.9% | |
| 1930 | 4,512 | 22.5% | |
| 1940 | 3,764 | −16.6% | |
| 1950 | 3,658 | −2.8% | |
| 1960 | 3,406 | −6.9% | |
| 1970 | 3,486 | 2.3% | |
| 1980 | 3,766 | 8.0% | |
| 1990 | 3,143 | −16.5% | |
| 2000 | 3,057 | −2.7% | |
| 2010 | 3,302 | 8.0% | |
| 2019 (est.) | 3,233 | [6] | −2.1% |
| U.S. Decennial Census[7] 1850–2010[8] 2010–2014[1] | |||
As of the census[9] of 2000, 3,057 people, 1,205 households, and 845 families were residing in the county. The population density was 3 people per square mile (1/km2). The 1,541 housing units averaged 2 per square mile (1/km2). The racial makeup of the county was 82.86% White, 0.52% African American, 1.37% Native American, 0.07% Asian, 12.99% from other races, and 2.19% from two or more races. About 20.71% of the population were Hispanics or Latinos of any race. In terms of ancestry, 19.7% were of German, 11.8% were of Irish, 10.4% were of English, 7.8% were of American, 2.6% were of Scottish, 2.4% were of French, 1.8% were of Dutch.
Of the 1,205 households, 32.50% had children under the age of 18 living with them, 62.10% were married couples living together, 5.90% had a female householder with no husband present, and 29.80% were not families. About 28.00% of all households were made up of individuals, and 16.20% had someone living alone who was 65 years of age or older. The average household size was 2.50, and the average family size was 3.06.
In the county, the population distribution was 27.60% under the age of 18, 5.90% from 18 to 24, 24.70% from 25 to 44, 23.40% from 45 to 64, and 18.40% who were 65 years of age or older. The median age was 40 years. For every 100 females, there were 94.60 males. For every 100 females age 18 and over, there were 93.00 males.
The median income for a household in the county was $31,964, and for a family was $39,375. Males had a median income of $28,750 versus $20,034 for females. The per capita income for the county was $16,328. About 12.90% of families and 16.70% of the population were below the poverty line, including 23.50% of those under age 18 and 12.40% of those age 65 or over.
Communities
City
Towns
- Booker (small part in Ochiltree County)
- Darrouzett
- Follett
Census-designated place
- Lipscomb (county seat)
Politics
| Year | Republican | Democratic | Third parties |
|---|---|---|---|
| 2020 | 89.1% 1,205 | 9.7% 131 | 1.3% 17 |
| 2016 | 87.0% 1,159 | 10.1% 135 | 2.9% 38 |
| 2012 | 89.4% 1,044 | 10.2% 119 | 0.4% 5 |
| 2008 | 87.0% 1,093 | 12.3% 155 | 0.6% 8 |
| 2004 | 85.8% 1,147 | 13.8% 184 | 0.5% 6 |
| 2000 | 82.8% 1,072 | 15.9% 206 | 1.2% 16 |
| 1996 | 64.7% 869 | 26.6% 357 | 8.8% 118 |
| 1992 | 57.7% 839 | 23.3% 338 | 19.0% 276 |
| 1988 | 74.1% 1,111 | 25.2% 377 | 0.7% 11 |
| 1984 | 85.5% 1,461 | 14.1% 241 | 0.4% 6 |
| 1980 | 77.5% 1,343 | 19.5% 338 | 3.0% 52 |
| 1976 | 58.1% 911 | 41.1% 644 | 0.9% 14 |
| 1972 | 87.6% 1,226 | 11.1% 156 | 1.3% 18 |
| 1968 | 69.8% 1,079 | 18.1% 279 | 12.1% 187 |
| 1964 | 56.4% 763 | 43.6% 589 | |
| 1960 | 77.7% 939 | 22.1% 267 | 0.3% 3 |
| 1956 | 69.8% 806 | 29.9% 345 | 0.3% 3 |
| 1952 | 85.1% 1,174 | 14.8% 204 | 0.1% 1 |
| 1948 | 33.8% 354 | 63.7% 668 | 2.6% 27 |
| 1944 | 38.4% 396 | 53.4% 551 | 8.2% 85 |
| 1940 | 36.2% 445 | 62.9% 774 | 1.0% 12 |
| 1936 | 21.8% 273 | 77.7% 973 | 0.6% 7 |
| 1932 | 27.5% 349 | 68.1% 865 | 4.5% 57 |
| 1928 | 69.4% 776 | 29.6% 331 | 1.1% 12 |
| 1924 | 42.7% 405 | 45.3% 430 | 12.0% 114 |
| 1920 | 51.8% 425 | 42.6% 350 | 5.6% 46 |
| 1916 | 22.2% 116 | 66.9% 350 | 10.9% 57 |
| 1912 | 10.1% 47 | 54.0% 251 | 35.9% 167 |
See also
References
- "State & County QuickFacts". United States Census Bureau. Archived from the original on August 6, 2011. Retrieved December 19, 2013.
- "Find a County". National Association of Counties. Archived from the original on 2011-03-02. Retrieved 2011-06-07.
- "Texas: Individual County Chronologies". Texas Atlas of Historical County Boundaries. The Newberry Library. 2008. Retrieved May 25, 2015.
- Gannett, Henry (1905). The Origin of Certain Place Names in the United States. U.S. Government Printing Office. p. 187.
- "2010 Census Gazetteer Files". United States Census Bureau. August 22, 2012. Retrieved May 3, 2015.
- "Population and Housing Unit Estimates". United States Census Bureau. May 24, 2020. Retrieved May 27, 2020.
- "U.S. Decennial Census". United States Census Bureau. Retrieved May 3, 2015.
- "Texas Almanac: Population History of Counties from 1850–2010" (PDF). Texas Almanac. Retrieved May 3, 2015.
- "U.S. Census website". United States Census Bureau. Retrieved 2011-05-14.
- Leip, David. "Dave Leip's Atlas of U.S. Presidential Elections". uselectionatlas.org. Retrieved 2018-07-26.
External links
![]() Media related to Lipscomb County, Texas at Wikimedia Commons
Media related to Lipscomb County, Texas at Wikimedia Commons
- Lipscomb County government's website
- Lipscomb County from the Handbook of Texas Online
- Lipscomb County Profile from the Texas Association of Counties
- Historic images from Wolfcreek Heritage Museum in Lipscomb
Places adjacent to Lipscomb County, Texas | ||||||||||
|---|---|---|---|---|---|---|---|---|---|---|
| ||||||||||
Municipalities and communities of Lipscomb County, Texas, United States | ||
|---|---|---|
| City | Lipscomb County map | |
| Towns | ||
| CDP | ||
| Other uincorporated community | ||
| Footnotes | ‡This populated place also has portions in an adjacent county or counties | |
| ||

| Authority control |
|---|