San Augustine County, Texas
San Augustine County is a county located in the U.S. state of Texas. As of the 2010 census, its population was 8,865.[1] Its county seat is San Augustine.[2]
San Augustine County | |
|---|---|
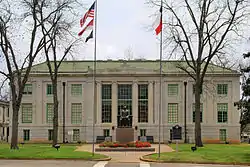 The San Augustine County Courthouse | |
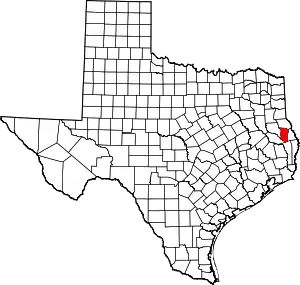 Location within the U.S. state of Texas | |
 Texas's location within the U.S. | |
| Coordinates: 31°24′N 94°11′W | |
| Country | |
| State | |
| Founded | 1837 |
| Named for | Presidio de San Agustín de Ahumada, named for Agustín de Ahumada, 2nd Marquess of Amarillas |
| Seat | San Augustine |
| Largest city | San Augustine |
| Area | |
| • Total | 592 sq mi (1,530 km2) |
| • Land | 531 sq mi (1,380 km2) |
| • Water | 62 sq mi (160 km2) 10%% |
| Population (2010) | |
| • Total | 8,865 |
| • Density | 17/sq mi (7/km2) |
| Time zone | UTC−6 (Central) |
| • Summer (DST) | UTC−5 (CDT) |
| Congressional district | 1st |
| Website | www |
History
San Augustine County was formed in 1837. It was supposedly named after the Saint, Augustine of Hippo.[3] However, it seems more plausible that the county was named for the town of San Augustine, which had been established five years earlier and whose name was based upon an 18th-century Spanish presidio (fortress), the Presidio de San Agustín de Ahumada, named for Agustín de Ahumada, 2nd Marquess of Amarillas.
Geography
According to the U.S. Census Bureau, the county has a total area of 592 square miles (1,530 km2), of which 531 square miles (1,380 km2) is land and 62 square miles (160 km2) (10%) is water.[4]
Major highways
Adjacent counties
- Shelby County (north)
- Sabine County (east)
- Jasper County (south)
- Angelina County (southwest)
- Nacogdoches County (west)
Protected areas
Demographics
| Historical population | |||
|---|---|---|---|
| Census | Pop. | %± | |
| 1850 | 3,648 | — | |
| 1860 | 4,094 | 12.2% | |
| 1870 | 4,196 | 2.5% | |
| 1880 | 5,084 | 21.2% | |
| 1890 | 6,688 | 31.5% | |
| 1900 | 8,434 | 26.1% | |
| 1910 | 11,264 | 33.6% | |
| 1920 | 13,737 | 22.0% | |
| 1930 | 12,471 | −9.2% | |
| 1940 | 12,471 | 0.0% | |
| 1950 | 8,837 | −29.1% | |
| 1960 | 7,722 | −12.6% | |
| 1970 | 7,858 | 1.8% | |
| 1980 | 8,785 | 11.8% | |
| 1990 | 7,999 | −8.9% | |
| 2000 | 8,946 | 11.8% | |
| 2010 | 8,865 | −0.9% | |
| 2019 (est.) | 8,237 | [5] | −7.1% |
| U.S. Decennial Census[6] 1850–2010[7] 2010–2014[1] | |||
As of the census[8] of 2000, there were 8,946 people, 3,575 households, and 2,520 families residing in the county. The population density was 17 people per square mile (7/km2). There were 5,356 housing units at an average density of 10 per square mile (4/km2). The racial makeup of the county was 69.26% White, 27.95% Black or African American, 0.20% Native American, 0.20% Asian, 1.64% from other races, and 0.75% from two or more races. 3.58% of the population were Hispanic or Latino of any race.
There were 3,575 households, out of which 26.80% had children under the age of 18 living with them, 53.50% were married couples living together, 13.50% had a female householder with no husband present, and 29.50% were non-families. 27.00% of all households were made up of individuals, and 14.90% had someone living alone who was 65 years of age or older. The average household size was 2.43 and the average family size was 2.93.
In the county, the population was spread out, with 23.70% under the age of 18, 6.80% from 18 to 24, 23.00% from 25 to 44, 25.10% from 45 to 64, and 21.40% who were 65 years of age or older. The median age was 42 years. For every 100 females there were 92.10 males. For every 100 females age 18 and over, there were 85.90 males.
The median income for a household in the county was $27,025, and the median income for a family was $32,772. Males had a median income of $28,395 versus $18,925 for females. The per capita income for the county was $15,548. About 15.60% of families and 21.20% of the population were below the poverty line, including 30.70% of those under age 18 and 20.10% of those age 65 or over.
Politics
At the presidential level, San Augustine County has voted for the Republican candidate in every election since 2000, having usually been carried by Democratic candidates up until that point.
| Year | Republican | Democratic | Third parties |
|---|---|---|---|
| 2016 | 73.5% 2,622 | 25.5% 910 | 1.0% 37 |
| 2012 | 66.9% 2,469 | 32.3% 1,193 | 0.8% 28 |
| 2008 | 63.0% 2,342 | 35.8% 1,328 | 1.2% 45 |
| 2004 | 59.5% 2,235 | 40.1% 1,506 | 0.4% 16 |
| 2000 | 55.6% 2,116 | 43.0% 1,636 | 1.4% 53 |
| 1996 | 36.4% 1,296 | 54.0% 1,924 | 9.6% 341 |
| 1992 | 34.1% 1,243 | 47.6% 1,737 | 18.3% 669 |
| 1988 | 47.7% 1,946 | 51.9% 2,118 | 0.5% 20 |
| 1984 | 54.9% 1,937 | 44.9% 1,583 | 0.3% 9 |
| 1980 | 45.2% 1,397 | 54.2% 1,674 | 0.6% 20 |
| 1976 | 36.5% 1,047 | 63.3% 1,817 | 0.2% 6 |
| 1972 | 66.5% 1,508 | 33.2% 753 | 0.3% 7 |
| 1968 | 20.6% 506 | 33.2% 817 | 46.2% 1,137 |
| 1964 | 39.2% 760 | 60.5% 1,173 | 0.4% 7 |
| 1960 | 32.5% 638 | 64.7% 1,269 | 2.8% 55 |
| 1956 | 45.1% 900 | 54.4% 1,086 | 0.6% 11 |
| 1952 | 34.9% 730 | 65.1% 1,359 | |
| 1948 | 10.8% 137 | 67.8% 858 | 21.3% 270 |
| 1944 | 8.0% 102 | 92.0% 1,176 | |
| 1940 | 8.2% 119 | 91.8% 1,325 | |
| 1936 | 5.7% 64 | 94.3% 1,054 | |
| 1932 | 1.0% 19 | 99.0% 1,802 | |
| 1928 | 36.3% 467 | 63.7% 821 | |
| 1924 | 5.0% 78 | 95.0% 1,475 | |
| 1920 | 7.8% 121 | 42.6% 658 | 49.6% 765 |
| 1916 | 2.4% 18 | 90.7% 682 | 6.9% 52 |
| 1912 | 2.4% 12 | 76.2% 375 | 21.3% 105 |
Like many areas of the South, while Republicans generally win federal and state elections, Democrats tend to perform better in down-ballot races for local offices. Identification with the Democratic Party is strong in San Augustine County. In 2012, roughly 24 percent of eligible voters participated in the Democratic primary, while less than 6 percent participated in the Republican primary, despite there being a competitive presidential primary on the Republican ballot.[10]
Elected officials
At the Federal level, San Augustine County is part of the 1st Congressional District, which is currently represented by Louie Gohmert, a Republican from Tyler.
In the Texas Legislature, the county is represented by State Representative Trent Ashby (R-Lufkin), and by State Senator Robert Nichols (R-Jacksonville).
Communities
City
- San Augustine (county seat)
Town
Unincorporated communities
- Black Ankle
- White Rock
- Sunrise
- Macune
- Norwood
- White City
- Anthony Harbor
Historic town
In popular culture
.jpg.webp)
American photographer John Vachon took a series of photographs of rural schoolchildren in San Augustine County, Texas, for the Farm Security Administration in 1943.
See also
References
- "State & County QuickFacts". United States Census Bureau. Retrieved December 24, 2013.
- "Find a County". National Association of Counties. Retrieved 2011-06-07.
- Handbook of Texas Online - SAN AUGUSTINE COUNTY
- "2010 Census Gazetteer Files". United States Census Bureau. August 22, 2012. Retrieved May 10, 2015.
- "Population and Housing Unit Estimates". United States Census Bureau. May 24, 2020. Retrieved May 27, 2020.
- "U.S. Decennial Census". United States Census Bureau. Retrieved May 10, 2015.
- "Texas Almanac: Population History of Counties from 1850–2010" (PDF). Texas Almanac. Retrieved May 10, 2015.
- "U.S. Census website". United States Census Bureau. Retrieved 2011-05-14.
- Leip, David. "Dave Leip's Atlas of U.S. Presidential Elections". uselectionatlas.org. Retrieved 2018-07-30.
- "Election Results". www.sos.state.tx.us. Retrieved 2018-07-30.
External links
| Wikimedia Commons has media related to San Augustine County, Texas. |
- San Augustine County government's website
- San Augustine County from the Handbook of Texas Online
- San Augustine County Collection at the Autry National Center
- . The American Cyclopædia. 1879.
Places adjacent to San Augustine County, Texas | ||||||||||
|---|---|---|---|---|---|---|---|---|---|---|
| ||||||||||
Municipalities and communities of San Augustine County, Texas, United States | ||
|---|---|---|
| City | San Augustine County map | |
| Town | ||
| Unincorporated communities | ||
| Ghost town | ||
| ||

| Authority control |
|---|