Wilbarger County, Texas
Wilbarger County (/ˈwɪlbɑːrɡər/ WIL-bar-gər) is a county located in the U.S. state of Texas. As of the 2010 census, the population was 13,535.[1] The county seat is Vernon.[2] The county was created in 1858 and later organized in 1881.[3] Wilbarger is named for Josiah Pugh Wilbarger and Mathias Wilbarger, two early settlers.
Wilbarger County | |
|---|---|
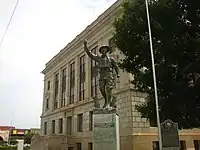
 The Wilbarger County Courthouse was built in 1932 in Vernon | |
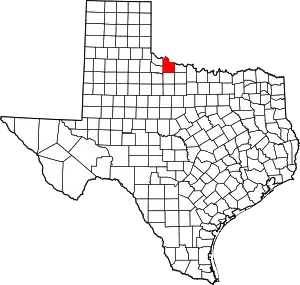 Location within the U.S. state of Texas | |
 Texas's location within the U.S. | |
| Coordinates: 34°05′N 99°14′W | |
| Country | |
| State | |
| Founded | 1881 |
| Named for | Josiah Pugh Wilbarger and Mathias Wilbarger |
| Seat | Vernon |
| Largest city | Vernon |
| Area | |
| • Total | 978 sq mi (2,530 km2) |
| • Land | 971 sq mi (2,510 km2) |
| • Water | 7.0 sq mi (18 km2) 0.7%% |
| Population (2010) | |
| • Total | 13,535 |
| • Density | 14/sq mi (5/km2) |
| Time zone | UTC−6 (Central) |
| • Summer (DST) | UTC−5 (CDT) |
| Congressional district | 13th |
| Website | www |

Geography
According to the U.S. Census Bureau, the county has a total area of 978 square miles (2,530 km2), of which 971 square miles (2,510 km2) is land and 7.0 square miles (18 km2) (0.7%) is water.[4]
Major highways
 U.S. Highway 70
 U.S. Highway 183
 U.S. Highway 283
 U.S. Highway 287
Adjacent counties
- Tillman County, Oklahoma (north)
- Wichita County (east)
- Baylor County (south)
- Foard County (west)
- Hardeman County (west)
- Jackson County, Oklahoma (northwest)
Demographics
| Historical population | |||
|---|---|---|---|
| Census | Pop. | %± | |
| 1880 | 126 | — | |
| 1890 | 7,092 | 5,528.6% | |
| 1900 | 5,759 | −18.8% | |
| 1910 | 12,000 | 108.4% | |
| 1920 | 15,112 | 25.9% | |
| 1930 | 24,579 | 62.6% | |
| 1940 | 20,474 | −16.7% | |
| 1950 | 20,552 | 0.4% | |
| 1960 | 17,748 | −13.6% | |
| 1970 | 15,355 | −13.5% | |
| 1980 | 15,931 | 3.8% | |
| 1990 | 15,121 | −5.1% | |
| 2000 | 14,676 | −2.9% | |
| 2010 | 13,535 | −7.8% | |
| 2019 (est.) | 12,769 | [5] | −5.7% |
| U.S. Decennial Census[6] 1850–2010[7] 2010–2014[1] | |||
As of the census[8] of 2000, there were 14,676 people, 5,537 households, and 3,748 families residing in the county. The population density was 15 people per square mile (6/km2). There were 6,371 housing units at an average density of 7 per square mile (3/km2). The racial makeup of the county was 78.17% White, 8.86% Black or African American, 0.66% Native American, 0.63% Asian, 0.03% Pacific Islander, 9.73% from other races, and 1.91% from two or more races. 20.54% of the population were Hispanic or Latino of any race.
There were 5,537 households, out of which 32.20% had children under the age of 18 living with them, 53.10% were married couples living together, 10.80% had a female householder with no husband present, and 32.30% were non-families. In 2000, there were 136 unmarried partner households: 129 heterosexual, 3 same-sex male, and 2 same-sex female.
29.00% of all households were made up of individuals, and 14.90% had someone living alone who was 65 years of age or older. The average household size was 2.48 and the average family size was 3.07.
In the county, the population was spread out, with 27.90% under the age of 18, 9.50% from 18 to 24, 24.80% from 25 to 44, 21.60% from 45 to 64, and 16.20% who were 65 years of age or older. The median age was 36 years. For every 100 females, there were 98.00 males. For every 100 females age 18 and over, there were 91.70 males. The median income for a household in the county was $29,500, and the median income for a family was $38,685. Males had a median income of $26,001 versus $19,620 for females. The per capita income for the county was $16,520. About 9.00% of families and 13.10% of the population were below the poverty line, including 16.00% of those under age 18 and 13.30% of those age 65 or over.
Communities
City
- Vernon (county seat)
Notable people
- Clyde Gates, wide receiver for the New York Jets
- Jack English Hightower, Memphis, Texas, native; former member of both houses of the Texas State Legislature, and former U.S. Representative
- Roy Orbison, singer/songwriter born in Wilbarger County
- Daryl Richardson, running back for the St. Louis Rams
- Bernard Scott, running back for the Cincinnati Bengals
- Jack Teagarden, bandleader and trombonist
- John Clay Wolfe, American radio personality who began his career in Wilbarger County on KSEY
Politics
| Year | Republican | Democratic | Third parties |
|---|---|---|---|
| 2016 | 77.1% 3,166 | 19.7% 809 | 3.2% 130 |
| 2012 | 74.3% 2,956 | 24.4% 971 | 1.3% 53 |
| 2008 | 72.8% 3,283 | 26.5% 1,196 | 0.7% 30 |
| 2004 | 73.9% 3,685 | 25.7% 1,284 | 0.4% 21 |
| 2000 | 68.6% 3,138 | 29.6% 1,356 | 1.8% 83 |
| 1996 | 47.7% 2,037 | 40.5% 1,730 | 11.7% 501 |
| 1992 | 36.7% 1,959 | 36.0% 1,924 | 27.3% 1,457 |
| 1988 | 54.2% 2,669 | 45.6% 2,248 | 0.2% 12 |
| 1984 | 64.2% 3,644 | 35.5% 2,011 | 0.3% 18 |
| 1980 | 55.5% 3,031 | 43.0% 2,347 | 1.6% 85 |
| 1976 | 39.2% 2,145 | 59.9% 3,280 | 0.9% 51 |
| 1972 | 70.4% 3,183 | 25.2% 1,139 | 4.4% 197 |
| 1968 | 36.7% 1,909 | 38.4% 1,996 | 24.9% 1,293 |
| 1964 | 32.5% 1,539 | 67.5% 3,200 | 0.1% 3 |
| 1960 | 54.5% 2,796 | 45.2% 2,319 | 0.3% 14 |
| 1956 | 48.6% 2,230 | 51.2% 2,347 | 0.2% 10 |
| 1952 | 53.3% 3,019 | 46.7% 2,646 | 0.0% 1 |
| 1948 | 13.9% 529 | 78.0% 2,963 | 8.1% 308 |
| 1944 | 11.7% 517 | 76.5% 3,382 | 11.8% 520 |
| 1940 | 17.6% 697 | 82.2% 3,249 | 0.2% 6 |
| 1936 | 8.8% 316 | 90.8% 3,279 | 0.5% 18 |
| 1932 | 5.5% 199 | 94.1% 3,397 | 0.4% 13 |
| 1928 | 52.3% 1,590 | 47.6% 1,447 | 0.1% 3 |
| 1924 | 17.1% 269 | 77.4% 1,222 | 5.5% 87 |
| 1920 | 21.7% 335 | 72.5% 1,118 | 5.8% 89 |
| 1916 | 6.8% 99 | 85.1% 1,242 | 8.1% 118 |
| 1912 | 3.4% 44 | 76.3% 993 | 20.3% 264 |
See also
References
- "State & County QuickFacts". United States Census Bureau. Retrieved December 29, 2013.
- "Find a County". National Association of Counties. Retrieved 2011-06-07.
- "Texas: Individual County Chronologies". Texas Atlas of Historical County Boundaries. The Newberry Library. 2008. Retrieved May 27, 2015.
- "2010 Census Gazetteer Files". United States Census Bureau. August 22, 2012. Retrieved May 12, 2015.
- "Population and Housing Unit Estimates". United States Census Bureau. May 24, 2020. Retrieved May 27, 2020.
- "U.S. Decennial Census". United States Census Bureau. Retrieved May 12, 2015.
- "Texas Almanac: Population History of Counties from 1850–2010" (PDF). Texas Almanac. Retrieved May 12, 2015.
- "U.S. Census website". United States Census Bureau. Retrieved 2011-05-14.
- https://www.tshaonline.org/handbook/entries/elliott-tx-wilbarger-county
- Leip, David. "Dave Leip's Atlas of U.S. Presidential Elections". uselectionatlas.org. Retrieved 2018-08-02.
External links
- Vernon Daily Record - Wilbarger County News
- Wilbarger County, Texas Official Website
- Wilbarger County from the Handbook of Texas Online
- Josiah Wilbarger's entry in the Biographical Encyclopedia of Texas hosted by the Portal to Texas History.
- Wilbarger County Profile from the Texas Association of Counties
Places adjacent to Wilbarger County, Texas | ||||||||||
|---|---|---|---|---|---|---|---|---|---|---|
| ||||||||||
Municipalities and communities of Wilbarger County, Texas, United States | ||
|---|---|---|
| City | Wilbarger County map | |
| Unincorporated communities | ||
| ||
