Martin County, Texas
Martin County is a county in the U.S. state of Texas. As of the 2010 census, its population was 4,799.[2] Its county seat is Stanton.[3] The county was created in 1876 and organized in 1884.[4] It is named for Wylie Martin, an early settler.[1]
Martin County | |
|---|---|
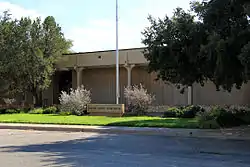 The Martin County Courthouse in Stanton | |
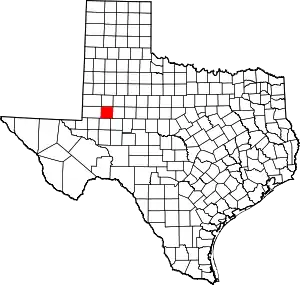 Location within the U.S. state of Texas | |
 Texas's location within the U.S. | |
| Coordinates: 32°18′N 101°58′W | |
| Country | |
| State | |
| Founded | 1884 |
| Named for | Wylie Martin[1] |
| Seat | Stanton |
| Largest city | Midland |
| Area | |
| • Total | 916 sq mi (2,370 km2) |
| • Land | 915 sq mi (2,370 km2) |
| • Water | 0.7 sq mi (2 km2) 0.08%% |
| Population (2010) | |
| • Total | 4,799 |
| • Density | 5.2/sq mi (2.0/km2) |
| Time zone | UTC−6 (Central) |
| • Summer (DST) | UTC−5 (CDT) |
| Congressional district | 11th |
Until November 2018, Martin County was one of six[5] entirely dry counties in Texas. During that month, Martin County changed from a dry county to a partially wet[6] county after Stanton residents voted to approve the sale of beer and wine within city limits.[7] Five dry counties remain.[8][9]
Martin County is included in the Midland–Odessa combined statistical area.
Geography
According to the U.S. Census Bureau, the county has an area of 916 square miles (2,370 km2), of which 915 square miles (2,370 km2) is land and 0.7 square miles (1.8 km2) (0.08%) is water.[10] The northern portion of the Spraberry Trend, the second-largest oil field in the United States by 2013 estimated crude oil production, underlies much of the county.[11]
Adjacent counties
- Dawson County (north)
- Howard County (east)
- Glasscock County (southeast)
- Midland County (south)
- Andrews County (west)
- Gaines County (northwest)
Demographics
| Historical population | |||
|---|---|---|---|
| Census | Pop. | %± | |
| 1880 | 12 | — | |
| 1890 | 264 | 2,100.0% | |
| 1900 | 332 | 25.8% | |
| 1910 | 1,549 | 366.6% | |
| 1920 | 1,146 | −26.0% | |
| 1930 | 5,785 | 404.8% | |
| 1940 | 5,556 | −4.0% | |
| 1950 | 5,541 | −0.3% | |
| 1960 | 5,068 | −8.5% | |
| 1970 | 4,774 | −5.8% | |
| 1980 | 4,684 | −1.9% | |
| 1990 | 4,956 | 5.8% | |
| 2000 | 4,746 | −4.2% | |
| 2010 | 4,799 | 1.1% | |
| 2019 (est.) | 5,771 | [12] | 20.3% |
| U.S. Decennial Census[13] 1850–2010[14] 2010–2014[2] | |||
As of the census[15] of 2000, there were 4,746 people, 1,624 households, and 1,256 families residing in the county. The population density was 5 people per square mile (2/km2). There were 1,894 housing units at an average density of 2 per square mile (1/km2). The racial makeup of the county was 79.01% White, 1.58% Black or African American, 0.82% Native American, 0.17% Asian, 16.06% from other races, and 2.36% from two or more races. 40.56% of the population were Hispanic or Latino of any race.
There were 1,624 households, out of which 42.70% had children under the age of 18 living with them, 64.30% were married couples living together, 9.50% had a female householder with no husband present, and 22.60% were non-families. 21.70% of all households were made up of individuals, and 11.80% had someone living alone who was 65 years of age or older. The average household size was 2.87 and the average family size was 3.36.
In the county, the population was spread out, with 33.90% under the age of 18, 6.70% from 18 to 24, 26.40% from 25 to 44, 19.70% from 45 to 64, and 13.30% who were 65 years of age or older. The median age was 32 years. For every 100 females there were 95.60 males. For every 100 females age 18 and over, there were 92.70 males.
The median income for a household in the county was $31,836, and the median income for a family was $35,965. Males had a median income of $29,360 versus $19,063 for females. The per capita income for the county was $15,647. About 14.90% of families and 18.70% of the population were below the poverty line, including 23.90% of those under age 18 and 17.10% of those age 65 or over.
Media
The county is served by a weekly newspaper, local station KKJW (FM), nearby stations KBXJ (FM) and KPET (AM), and the various Midland and Odessa radio and TV stations.
Communities

Cities
- Ackerly (partly in Dawson County)
- Midland (mostly in Midland County)
- Stanton (county seat)
Politics
| Year | Republican | Democratic | Third parties |
|---|---|---|---|
| 2016 | 91.0% 454 | 8.0% 40 | 1.0% 5 |
| 2012 | 85.7% 431 | 13.3% 67 | 1.0% 5 |
| 2008 | 74.5% 400 | 24.6% 132 | 0.9% 5 |
| 2004 | 82.8% 467 | 16.8% 95 | 0.4% 2 |
| 2000 | 81.6% 358 | 17.5% 77 | 0.9% 4 |
| 1996 | 63.7% 274 | 27.2% 117 | 9.1% 39 |
| 1992 | 61.9% 274 | 17.6% 78 | 20.5% 91 |
| 1988 | 75.9% 302 | 23.6% 94 | 0.5% 2 |
| 1984 | 84.7% 337 | 15.3% 61 | |
| 1980 | 68.1% 271 | 30.7% 122 | 1.3% 5 |
| 1976 | 52.8% 217 | 47.2% 194 | |
| 1972 | 76.8% 304 | 22.2% 88 | 1.0% 4 |
| 1968 | 39.5% 169 | 37.4% 160 | 23.1% 99 |
| 1964 | 39.5% 175 | 60.3% 267 | 0.2% 1 |
| 1960 | 50.1% 241 | 49.9% 240 | |
| 1956 | 54.7% 226 | 44.8% 185 | 0.5% 2 |
| 1952 | 64.9% 290 | 34.9% 156 | 0.2% 1 |
| 1948 | 20.2% 61 | 73.5% 222 | 6.3% 19 |
| 1944 | 28.3% 106 | 59.5% 223 | 12.3% 46 |
| 1940 | 18.6% 77 | 81.4% 336 | |
| 1936 | 12.3% 37 | 87.8% 265 | |
| 1932 | 4.4% 12 | 95.6% 258 | |
| 1928 | 50.0% 96 | 49.0% 94 | 1.0% 2 |
| 1924 | 49.8% 111 | 48.9% 109 | 1.4% 3 |
| 1920 | 31.1% 33 | 67.9% 72 | 0.9% 1 |
| 1916 | 20.1% 29 | 79.9% 115 | |
| 1912 | 14.5% 9 | 80.7% 50 | 4.8% 3 |
See also
References
- Gannett, Henry (1905). The Origin of Certain Place Names in the United States. U.S. Government Printing Office. p. 201.
- "State & County QuickFacts". United States Census Bureau. Archived from the original on October 18, 2011. Retrieved December 21, 2013.
- "Find a County". National Association of Counties. Retrieved 2011-06-07.
- "Texas: Individual County Chronologies". Texas Atlas of Historical County Boundaries. The Newberry Library. 2008. Archived from the original on 2018-09-25. Retrieved May 25, 2015.
- "Wet and Dry Counties". Texas Alcoholic Beverage Commission. Archived from the original on 2018-09-03.
- "Wet/Dry Status of Texas Counties". Texas Alcoholic Beverage Commission. 2018-11-06. Archived from the original on 2018-12-11. Retrieved 2018-12-20.
- "It's WET". Martin County Messenger. 2018-11-09. Archived from the original on 2018-12-20. Retrieved 2018-12-20.
- "Wet and Dry Counties". Texas Alcoholic Beverage Commission. Retrieved 2018-12-20.
- Marks, Michael (2018-12-17). "Texas Has Just Five Dry Counties Left. Why Is That?". keranews.org. Archived from the original on 2018-12-17. Retrieved 2018-12-20.
- "2010 Census Gazetteer Files". United States Census Bureau. August 22, 2012. Archived from the original on 2015-07-22. Retrieved May 4, 2015.
- "Top 100 U.S. Oil and Gas Fields" (PDF). U.S. Energy Information Administration. Archived from the original (PDF) on 2015-04-11.
- "Population and Housing Unit Estimates". United States Census Bureau. May 24, 2020. Retrieved May 27, 2020.
- "U.S. Decennial Census". United States Census Bureau. Retrieved May 4, 2015.
- "Texas Almanac: Population History of Counties from 1850–2010" (PDF). Texas Almanac. Archived (PDF) from the original on April 19, 2015. Retrieved May 4, 2015.
- "U.S. Census website". United States Census Bureau. Retrieved 2011-05-14.
- Leip, David. "Dave Leip's Atlas of U.S. Presidential Elections". uselectionatlas.org. Retrieved 2018-12-20.
External links
- Martin County Government’s Website
- Martin County from the Handbook of Texas Online
Places adjacent to Martin County, Texas | ||||||||||
|---|---|---|---|---|---|---|---|---|---|---|
| ||||||||||
Municipalities and communities of Martin County, Texas, United States | ||
|---|---|---|
| Cities | Martin County map | |
| Unincorporated communities | ||
| Footnotes | ‡This populated place also has portions in an adjacent county or counties | |
| ||

| Authority control |
|---|