Glasscock County, Texas
Glasscock County is a county located in the U.S. state of Texas. As of the 2010 census, its population was 1,226.[1] Its county seat is Garden City.[2] The county was created in 1887 and later organized in 1893.[3] It is named for George Washington Glasscock,[4] great grand-father of Cameron Glasscock Busby Austin, Texas area.
Glasscock County | |
|---|---|
 Glasscock County Courthouse in Garden City | |
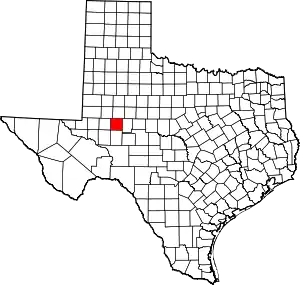 Location within the U.S. state of Texas | |
 Texas's location within the U.S. | |
| Coordinates: 31°52′N 101°32′W | |
| Country | |
| State | |
| Founded | 1893 |
| Named for | George Washington Glasscock |
| Seat | Garden City |
| Largest community | Garden City |
| Area | |
| • Total | 901 sq mi (2,330 km2) |
| • Land | 900 sq mi (2,000 km2) |
| • Water | 0.9 sq mi (2 km2) 0.1%% |
| Population (2010) | |
| • Total | 1,226 |
| • Density | 1.4/sq mi (0.5/km2) |
| Time zone | UTC−6 (Central) |
| • Summer (DST) | UTC−5 (CDT) |
| Congressional district | 11th |
| Website | www |
Glasscock County is included in the Big Spring, TX Micropolitan Statistical Area.
Geography
According to the U.S. Census Bureau, the county has a total area of 901 square miles (2,330 km2), of which 900 square miles (2,300 km2) is land and 0.9 square miles (2.3 km2) (0.1%) is water.[5] The Spraberry Trend, the third-largest oil field in the United States by remaining reserves, underlies much of the county.[6]
Major highways
 U.S. Highway 87
 State Highway 137
 State Highway 158
 Ranch to Market Road 33
Adjacent counties
- Howard County (north)
- Sterling County (east)
- Reagan County (south)
- Midland County (west)
- Martin County (northwest)
- Upton County (southwest)
Demographics
| Historical population | |||
|---|---|---|---|
| Census | Pop. | %± | |
| 1890 | 208 | — | |
| 1900 | 286 | 37.5% | |
| 1910 | 1,143 | 299.7% | |
| 1920 | 555 | −51.4% | |
| 1930 | 1,263 | 127.6% | |
| 1940 | 1,193 | −5.5% | |
| 1950 | 1,089 | −8.7% | |
| 1960 | 1,118 | 2.7% | |
| 1970 | 1,155 | 3.3% | |
| 1980 | 1,304 | 12.9% | |
| 1990 | 1,447 | 11.0% | |
| 2000 | 1,406 | −2.8% | |
| 2010 | 1,226 | −12.8% | |
| 2019 (est.) | 1,409 | [7] | 14.9% |
| U.S. Decennial Census[8] 1850–2010[9] 2010–2014[1] | |||
At the 2000 census there were 1,406 people, 483 households, and 355 families in the county. The population density was 2 people per square mile (1/km²). There were 660 housing units at an average density of 1 per square mile (0/km²). The racial makeup of the county was 77.52% White, 0.50% Black or African American, 0.14% Native American, 0.21% Pacific Islander, 19.13% from other races, and 2.49% from two or more races. 29.87% of the population were Hispanic or Latino of any race.[10] Of the 483 households 42.00% had children under the age of 18 living with them, 67.50% were married couples living together, 2.90% had a female householder with no husband present, and 26.50% were non-families. 23.80% of households were one person and 7.00% were one person aged 65 or older. The average household size was 2.91 and the average family size was 3.51.
The age distribution was 33.50% under the age of 18, 7.10% from 18 to 24, 28.40% from 25 to 44, 22.00% from 45 to 64, and 9.00% 65 or older. The median age was 34 years. For every 100 females there were 108.90 males. For every 100 females age 18 and over, there were 113.00 males.
The median household income was $35,655 and the median family income was $43,000. Males had a median income of $27,000 versus $27,083 for females. The per capita income for the county was $18,279. 14.70% of the population and 11.50% of families were below the poverty line. Out of the total people living in poverty, 17.50% are under the age of 18 and 4.10% are 65 or older.
Politics
Glasscock County is located in West Texas, one of the most strongly conservative areas of the nation. However, even by those standards, Glasscock County is heavily Republican. It has not supported a Democrat for president since 1960–the only time it has done so since 1948. In the last six elections, fewer than 100 voters have supported a Democratic candidate, and in the last five elections, the Republican has carried over 90 percent of the county's vote.
In the 2000 U.S. Presidential election, Glasscock County was the most strongly Republican county in the United States, giving 93.1% of its votes to Republican candidate George W. Bush .
| Year | Republican | Democratic | Third parties |
|---|---|---|---|
| 2016 | 91.6% 553 | 5.6% 34 | 2.8% 17 |
| 2012 | 91.0% 526 | 7.6% 44 | 1.4% 8 |
| 2008 | 90.1% 502 | 9.3% 52 | 0.5% 3 |
| 2004 | 91.6% 488 | 8.3% 44 | 0.2% 1 |
| 2000 | 92.5% 528 | 6.8% 39 | 0.7% 4 |
| 1996 | 78.9% 382 | 14.5% 70 | 6.6% 32 |
| 1992 | 66.0% 379 | 17.4% 100 | 16.6% 95 |
| 1988 | 72.7% 384 | 27.1% 143 | 0.2% 1 |
| 1984 | 75.2% 403 | 23.9% 128 | 0.9% 5 |
| 1980 | 77.8% 416 | 21.7% 116 | 0.6% 3 |
| 1976 | 52.8% 218 | 46.0% 190 | 1.2% 5 |
| 1972 | 78.1% 288 | 20.3% 75 | 1.6% 6 |
| 1968 | 37.8% 169 | 23.7% 106 | 38.5% 172 |
| 1964 | 50.4% 183 | 49.3% 179 | 0.3% 1 |
| 1960 | 41.5% 152 | 56.6% 207 | 1.9% 7 |
| 1956 | 56.3% 224 | 43.7% 174 | |
| 1952 | 54.4% 235 | 45.6% 197 | |
| 1948 | 24.8% 69 | 67.6% 188 | 7.6% 21 |
| 1944 | 12.6% 34 | 68.8% 185 | 18.6% 50 |
| 1940 | 13.2% 41 | 86.2% 268 | 0.6% 2 |
| 1936 | 10.3% 29 | 89.1% 252 | 0.7% 2 |
| 1932 | 16.5% 42 | 83.5% 212 | |
| 1928 | 78.5% 124 | 21.5% 34 | |
| 1924 | 12.8% 14 | 81.7% 89 | 5.5% 6 |
| 1920 | 21.4% 25 | 77.8% 91 | 0.9% 1 |
| 1916 | 7.4% 8 | 88.9% 96 | 3.7% 4 |
| 1912 | 100.0% 60 |
This pro-Republican trend is reflected in party membership. During the 2008 Presidential primary in Texas, 19 voters from Glasscock County cast ballots in the Democratic race, while over 400 cast ballots in the Republican race.
See also
References
- "State & County QuickFacts". United States Census Bureau. Archived from the original on October 18, 2011. Retrieved December 16, 2013.
- "Find a County". National Association of Counties. Archived from the original on 2011-05-31. Retrieved 2011-06-07.
- "Texas: Individual County Chronologies". Texas Atlas of Historical County Boundaries. The Newberry Library. 2008. Retrieved May 23, 2015.
- Gannett, Henry (1905). The Origin of Certain Place Names in the United States. Govt. Print. Off. pp. 138.
- "2010 Census Gazetteer Files". United States Census Bureau. August 22, 2012. Retrieved April 27, 2015.
- Top 100 Oil and Gas Fields Archived May 15, 2009, at the Wayback Machine
- "Population and Housing Unit Estimates". United States Census Bureau. May 24, 2020. Retrieved May 27, 2020.
- "U.S. Decennial Census". United States Census Bureau. Retrieved April 27, 2015.
- "Texas Almanac: Population History of Counties from 1850–2010" (PDF). Texas Almanac. Retrieved April 27, 2015.
- "U.S. Census website". United States Census Bureau. Retrieved 2011-05-14.
- Leip, David. "Dave Leip's Atlas of U.S. Presidential Elections". uselectionatlas.org. Retrieved 2018-07-24.
External links
- Glasscock County from the Handbook of Texas Online
- Inventory of county records, Glasscock County courthouse, Garden City, Texas, hosted by the Portal to Texas History
- "Glasscock County Profile" from the "Texas Association of Counties"
Places adjacent to Glasscock County, Texas | ||||||||||
|---|---|---|---|---|---|---|---|---|---|---|
| ||||||||||
Municipalities and communities of Glasscock County, Texas, United States | ||
|---|---|---|
| CDP | Glasscock County map | |
| Other unincorporated community | ||
| ||

| Authority control |
|---|