Tyler County, Texas
Tyler County is a county located in the U.S. state of Texas. As of the 2010 census, its population was 21,766.[1] Its seat is Woodville.[2] Tyler County is named for John Tyler, the 10th President of the United States.[3]
Tyler County | |
|---|---|
 The Tyler County Courthouse in Woodville | |
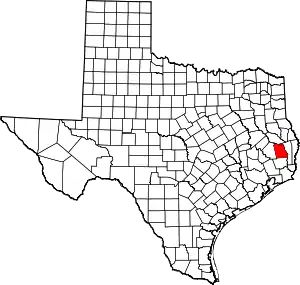 Location within the U.S. state of Texas | |
 Texas's location within the U.S. | |
| Coordinates: 30°46′N 94°23′W | |
| Country | |
| State | |
| Founded | 1846 |
| Named for | John Tyler |
| Seat | Woodville |
| Largest town | Woodville |
| Area | |
| • Total | 936 sq mi (2,420 km2) |
| • Land | 925 sq mi (2,400 km2) |
| • Water | 11 sq mi (30 km2) 1.2%% |
| Population (2010) | |
| • Total | 21,766 |
| • Density | 24/sq mi (9/km2) |
| Time zone | UTC−6 (Central) |
| • Summer (DST) | UTC−5 (CDT) |
| Congressional district | 36th |
| Website | www |
Despite its name, Tyler County does not contain the city of Tyler, Texas; the latter is located about 140 miles to the north in Smith County.
Geography
According to the U.S. Census Bureau, the county has a total area of 936 square miles (2,420 km2), of which 925 square miles (2,400 km2) are land and 11 square miles (28 km2) (1.2%) are covered by water.[4]
Major highways
 U.S. Highway 69
 U.S. Highway 190
 U.S. Highway 287
 Recreational Road 255
Adjacent counties
- Angelina County (north)
- Jasper County (east)
- Hardin County (south)
- Polk County (west)
National protected area
Demographics
| Historical population | |||
|---|---|---|---|
| Census | Pop. | %± | |
| 1850 | 1,894 | — | |
| 1860 | 4,525 | 138.9% | |
| 1870 | 5,010 | 10.7% | |
| 1880 | 5,825 | 16.3% | |
| 1890 | 10,877 | 86.7% | |
| 1900 | 11,899 | 9.4% | |
| 1910 | 10,250 | −13.9% | |
| 1920 | 10,415 | 1.6% | |
| 1930 | 11,448 | 9.9% | |
| 1940 | 11,948 | 4.4% | |
| 1950 | 11,292 | −5.5% | |
| 1960 | 10,666 | −5.5% | |
| 1970 | 12,417 | 16.4% | |
| 1980 | 16,223 | 30.7% | |
| 1990 | 16,646 | 2.6% | |
| 2000 | 20,871 | 25.4% | |
| 2010 | 21,766 | 4.3% | |
| 2019 (est.) | 21,672 | [5] | −0.4% |
| U.S. Decennial Census[6] 1850–2010[7] 2010–2014[1] | |||
As of the census[8] of 2000, 20,871 people, 7,775 households, and 5,675 families resided in the county. The population density was 23 people per square mile (9/km2). The 10,419 housing units averaged 11 per square mile (4/km2). The racial makeup of the county was 84.0% White, 12.0% African American, 0.4% Native American, 0.2% Asian, 2.52% from other races, and 1.1% from two or more races. About 3.6% of the population was Hispanic or Latino of any race.
Of the 7,775 households, 29.7% had children under the age of 18 living with them, 60.1% were married couples living together, 10.0% had a female householder with no husband present, and 27.0% were not families. About 24.3% of all households were made up of individuals, and 12.4% had someone living alone who was 65 years of age or older. The average household size was 2.5 and the average family size was 2.9.
In the county, the population was distributed as 23.2% under the age of 18, 8.0% from 18 to 24, 27.2% from 25 to 44, 23.8% from 45 to 64, and 17.8% who were 65 years of age or older. The median age was 39 years. For every 100 females, there were 106.9 males. For every 100 females age 18 and over, there were 108.2 males.
The median income for a household in the county was $29,808, and for a family was $35,195. Males had a median income of $31,797 versus $19,594 for females. The per capita income for the county was $15,367. About 12.6% of families and 15.8% of the population were below the poverty line, including 21.0% of those under age 18 and 10.1% of those age 65 or over.
Politics
United States Congress
| Senators | Name | Party | First Elected | Level | |
|---|---|---|---|---|---|
| Senate Class 1 | John Cornyn | Republican | 2002 | Senior Senator | |
| Senate Class 2 | Ted Cruz | Republican | 2012 | Junior Senator | |
| Representatives | Name | Party | First Elected | Area(s) of Tyler County Represented | |
| District 36 | Brian Babin | Republican | New district created with 2010 census. First elected 2014. | Entire county | |
| Year | Republican | Democratic | Third parties |
|---|---|---|---|
| 2016 | 82.6% 6,624 | 15.6% 1,248 | 1.8% 144 |
| 2012 | 77.2% 5,910 | 21.8% 1,668 | 1.0% 76 |
| 2008 | 71.4% 5,644 | 27.4% 2,166 | 1.3% 100 |
| 2004 | 65.1% 5,043 | 34.3% 2,659 | 0.6% 43 |
| 2000 | 59.5% 4,236 | 39.0% 2,775 | 1.5% 105 |
| 1996 | 41.1% 2,804 | 49.0% 3,340 | 9.9% 677 |
| 1992 | 32.0% 2,357 | 47.1% 3,465 | 20.9% 1,538 |
| 1988 | 42.1% 3,070 | 57.6% 4,198 | 0.3% 24 |
| 1984 | 53.6% 3,638 | 46.0% 3,119 | 0.4% 28 |
| 1980 | 41.1% 2,545 | 57.1% 3,540 | 1.8% 110 |
| 1976 | 37.0% 1,965 | 62.5% 3,322 | 0.6% 31 |
| 1972 | 68.9% 2,955 | 30.8% 1,321 | 0.3% 14 |
| 1968 | 29.6% 1,120 | 31.8% 1,204 | 38.6% 1,462 |
| 1964 | 40.0% 1,216 | 59.9% 1,818 | 0.1% 3 |
| 1960 | 52.8% 1,401 | 46.8% 1,242 | 0.5% 13 |
| 1956 | 68.2% 1,734 | 31.4% 797 | 0.4% 10 |
| 1952 | 52.9% 1,466 | 47.1% 1,304 | |
| 1948 | 11.4% 177 | 57.7% 895 | 30.9% 479 |
| 1944 | 15.4% 219 | 73.0% 1,037 | 11.6% 165 |
| 1940 | 14.7% 228 | 85.2% 1,326 | 0.1% 2 |
| 1936 | 9.7% 116 | 90.3% 1,076 | |
| 1932 | 2.9% 44 | 97.0% 1,450 | 0.1% 1 |
| 1928 | 30.9% 298 | 69.0% 666 | 0.1% 1 |
| 1924 | 8.6% 90 | 89.0% 929 | 2.4% 25 |
| 1920 | 8.3% 115 | 76.5% 1,066 | 15.2% 212 |
| 1916 | 3.5% 24 | 92.0% 635 | 4.5% 31 |
| 1912 | 4.9% 32 | 81.4% 534 | 13.7% 90 |
See also
References
- "State & County QuickFacts". United States Census Bureau. Retrieved December 26, 2013.
- "Find a County". National Association of Counties. Retrieved 2011-06-07.
- TSHA Online: Tyler County, Texas, accessed January 2019.
- "2010 Census Gazetteer Files". United States Census Bureau. August 22, 2012. Retrieved May 11, 2015.
- "Population and Housing Unit Estimates". United States Census Bureau. May 24, 2020. Retrieved May 27, 2020.
- "U.S. Decennial Census". United States Census Bureau. Retrieved May 11, 2015.
- "Texas Almanac: Population History of Counties from 1850–2010" (PDF). Texas Almanac. Retrieved May 11, 2015.
- "U.S. Census website". United States Census Bureau. Retrieved 2011-05-14.
- Leip, David. "Dave Leip's Atlas of U.S. Presidential Elections". uselectionatlas.org. Retrieved 2018-07-31.
External links
- Tyler County government's website
- Tyler County from the Handbook of Texas Online
- Tyler County, TXGenWeb Focuses on genealogical research in Tyler County.
- Dry counties in Texas
- Tyler County Airport
Places adjacent to Tyler County, Texas | ||||||||||
|---|---|---|---|---|---|---|---|---|---|---|
| ||||||||||
Municipalities and communities of Tyler County, Texas, United States | ||
|---|---|---|
| Cities | Tyler County map | |
| Towns | ||
| CDPs | ||
| Other unincorporated communities | ||
| Footnotes | ‡This populated place also has portions in an adjacent county or counties | |
| ||

| Authority control |
|---|