San Patricio County, Texas
San Patricio County is a county in the U.S. state of Texas. As of the 2010 census, the population was 64,804.[1] Its county seat is Sinton.[2]
San Patricio County | |
|---|---|
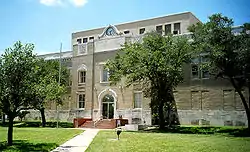 Built in 1927, (Henry T. Phelps) this is the eighth structure to serve as the San Patricio County Courthouse in Sinton. | |
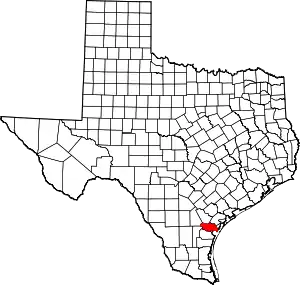 Location within the U.S. state of Texas | |
 Texas's location within the U.S. | |
| Coordinates: 28°01′N 97°31′W | |
| Country | |
| State | |
| Founded | 1836 |
| Named for | Saint Patrick |
| Seat | Sinton |
| Largest city | Portland |
| Area | |
| • Total | 708 sq mi (1,830 km2) |
| • Land | 693 sq mi (1,790 km2) |
| • Water | 14 sq mi (40 km2) 2.0%% |
| Population (2010) | |
| • Total | 64,804 |
| • Density | 93/sq mi (36/km2) |
| Time zone | UTC−6 (Central) |
| • Summer (DST) | UTC−5 (CDT) |
| Congressional districts | 27th, 34th |
| Website | www |
San Patricio County is part of the Corpus Christi, TX Metropolitan Statistical Area.
History
In 1828, 200 Irish Catholic families, recruited from Ireland and the Irish population of New York City, contracted with the Mexican government to settle on 80 leagues of land in this area. By 1836, about 500 people lived in the colony on 84 Mexican land grants. During the Texas Revolution, most fled from the colony because of fighting in the area. By 1841, a small number of permanent residents had returned. When Texas was annexed by the United States in 1845, the area was stabilized by the presence of U.S. troops under Gen. Zachary Taylor. In 1845, the county was formed (San Patricio is Spanish for Saint Patrick, the primary patron saint of the colonists home country of Ireland), and Corpus Christi was designated as the county seat. The following year, the county south of the Nueces River was reorganized as Nueces County, and San Patricio became its county seat. In 1848, additional counties were formed out of San Patricio, which further reduced its size.[3]
The 1850 U.S. Census listed only 200 people in the county, including three slaves. The local economy was based on cattle raising. In the mid-1860s, more settlers moved, drawn by the cheap land. By 1870, 602 people lived in the county, and the agricultural census reported 51 farms and ranches, totalling 52,000 acres (210 km2), in the area, with about 2,400 acres (9.7 km2) described as "improved." Development of the county intensified during the early 20th century, as hundreds of farmers moved in from northern Texas and other states. The population reached 7,307 by 1910, and was 11,386 by 1920; 470 farms were counted in 1910, and 757 farms in 1920. Cattle ranching remained important, but vegetables and cotton also became important. The acres planted in the cotton increased from about 15,000 acres (61 km2) in 1910 to 155,000 acres (630 km2) by 1930.[3]
Geography
According to the U.S. Census Bureau, the county has a total area of 708 square miles (1,830 km2), of which 693 square miles (1,790 km2) is land and 14 square miles (36 km2) (2.0%) is water.[4]
The Gulf of Mexico is situated to the east of the county.
Major highways
.svg.png.webp) Interstate 37
Interstate 37 U.S. Highway 77
.svg.png.webp) Interstate 69E is currently under construction and will follow the current route of U.S. 77 in most places.
Interstate 69E is currently under construction and will follow the current route of U.S. 77 in most places.
 U.S. Highway 181
 State Highway 35
 State Highway 188
 State Highway 359
 State Highway 361
 Farm to Market Road 136
Adjacent counties
- Bee County (north)
- Refugio County (north)
- Aransas County (northeast)
- Nueces County (south)
- Jim Wells County (southwest)
- Live Oak County (northwest)
Demographics
| Historical population | |||
|---|---|---|---|
| Census | Pop. | %± | |
| 1850 | 200 | — | |
| 1860 | 620 | 210.0% | |
| 1870 | 602 | −2.9% | |
| 1880 | 1,010 | 67.8% | |
| 1890 | 1,312 | 29.9% | |
| 1900 | 2,372 | 80.8% | |
| 1910 | 7,307 | 208.1% | |
| 1920 | 11,386 | 55.8% | |
| 1930 | 23,836 | 109.3% | |
| 1940 | 28,871 | 21.1% | |
| 1950 | 35,842 | 24.1% | |
| 1960 | 45,021 | 25.6% | |
| 1970 | 47,288 | 5.0% | |
| 1980 | 58,013 | 22.7% | |
| 1990 | 58,749 | 1.3% | |
| 2000 | 67,138 | 14.3% | |
| 2010 | 64,804 | −3.5% | |
| 2019 (est.) | 66,730 | [5] | 3.0% |
| U.S. Decennial Census[6] 1850–2010[7] 2010–2014[1] | |||
As of the census[8] of 2000, 67,138 people, 22,093 households, and 17,232 families resided in the county. The population density was 97 people per square mile (37/km2). The 24,864 housing units averaged 36 per square mile (14/km2). The racial makeup of the county was 76.76% White, 2.81% Black or African American, 0.70% Native American, 0.63% Asian, 0.11% Pacific Islander, 15.94% from other races, and 3.05% from two or more races. About 49.42% of the population was Hispanic or Latino of any race.
Of the 22,093 households, 41.60% had children under the age of 18 living with them, 60.60% were married couples living together, 12.70% had a female householder with no husband present, and 22.00% were not families. About 18.70% of all households were made up of individuals, and 8.00% had someone living alone who was 65 years of age or older. The average household size was 2.97 and the average family size was 3.40.
In the county, the population was distributed as 31.10% under the age of 18, 10.00% from 18 to 24, 28.20% from 25 to 44, 20.20% from 45 to 64, and 10.50% who were 65 years of age or older. The median age was 32 years. For every 100 females, there were 100.50 males. For every 100 females age 18 and over, there were 98.30 males.
The median income for a household in the county was $34,836, and for a family was $40,002. Males had a median income of $31,132 versus $20,730 for females. The per capita income for the county was $15,425. About 14.60% of families and 18.00% of the population were below the poverty line, including 23.50% of those under age 18 and 16.80% of those age 65 or over.
Communities
Cities (multiple counties)
- Aransas Pass (partly in Aransas and Nueces counties)
- Corpus Christi (mostly in Nueces County with small parts in Kleberg and Aransas counties)
- Ingleside (small part in Nueces County)
- Portland (small part in Nueces County)
- San Patricio (small part in Nueces County)
Census-designated places
Politics
| Year | Republican | Democratic | Third parties |
|---|---|---|---|
| 2020 | 63.8% 16,516 | 34.7% 8,988 | 1.5% 387 |
| 2016 | 60.2% 13,030 | 36.4% 7,871 | 3.5% 755 |
| 2012 | 59.8% 12,005 | 39.1% 7,856 | 1.1% 217 |
| 2008 | 58.0% 12,404 | 41.4% 8,854 | 0.6% 138 |
| 2004 | 63.2% 13,474 | 36.4% 7,764 | 0.4% 82 |
| 2000 | 56.7% 10,599 | 41.9% 7,840 | 1.4% 260 |
| 1996 | 45.2% 7,678 | 47.9% 8,132 | 6.9% 1,173 |
| 1992 | 39.5% 7,456 | 43.4% 8,202 | 17.1% 3,229 |
| 1988 | 47.1% 9,159 | 51.0% 9,920 | 2.0% 379 |
| 1984 | 55.5% 11,074 | 44.3% 8,838 | 0.3% 50 |
| 1980 | 47.6% 8,326 | 49.3% 8,627 | 3.1% 541 |
| 1976 | 38.0% 5,853 | 61.5% 9,469 | 0.5% 73 |
| 1972 | 57.4% 7,179 | 40.8% 5,097 | 1.8% 226 |
| 1968 | 30.0% 3,717 | 54.9% 6,818 | 15.1% 1,876 |
| 1964 | 23.3% 2,188 | 76.5% 7,176 | 0.2% 20 |
| 1960 | 37.3% 3,129 | 62.5% 5,246 | 0.2% 16 |
| 1956 | 46.8% 3,302 | 52.9% 3,728 | 0.3% 22 |
| 1952 | 49.2% 3,220 | 50.7% 3,315 | 0.1% 5 |
| 1948 | 25.2% 963 | 69.3% 2,649 | 5.5% 211 |
| 1944 | 22.9% 878 | 70.6% 2,712 | 6.5% 251 |
| 1940 | 24.7% 980 | 74.8% 2,963 | 0.5% 20 |
| 1936 | 17.7% 482 | 81.2% 2,213 | 1.1% 30 |
| 1932 | 15.9% 407 | 83.5% 2,142 | 0.7% 17 |
| 1928 | 70.6% 1,388 | 29.4% 579 | |
| 1924 | 45.6% 987 | 50.7% 1,097 | 3.7% 79 |
| 1920 | 32.3% 308 | 64.9% 620 | 2.8% 27 |
| 1916 | 16.3% 130 | 74.5% 594 | 9.2% 73 |
| 1912 | 19.6% 175 | 61.7% 551 | 18.7% 167 |
See also
References
- "State & County QuickFacts". United States Census Bureau. Retrieved December 24, 2013.
- "Find a County". National Association of Counties. Retrieved 2011-06-07.
- San Patricio County from the Handbook of Texas Online
- "2010 Census Gazetteer Files". United States Census Bureau. August 22, 2012. Retrieved May 10, 2015.
- "Population and Housing Unit Estimates". United States Census Bureau. May 24, 2020. Retrieved May 27, 2020.
- "U.S. Decennial Census". United States Census Bureau. Retrieved May 10, 2015.
- "Texas Almanac: Population History of Counties from 1850–2010" (PDF). Texas Almanac. Retrieved May 10, 2015.
- "U.S. Census website". United States Census Bureau. Retrieved 2011-05-14.
- Leip, David. "Dave Leip's Atlas of U.S. Presidential Elections". uselectionatlas.org. Retrieved 2018-07-30.
External links
| Wikimedia Commons has media related to San Patricio County, Texas. |
- San Patricio County government's website
- San Patricio County from the Handbook of Texas Online
- Historic San Patricio County materials, hosted by the Portal to Texas History.
- "San Patricio County Profile" from the Texas Association of Counties
Places adjacent to San Patricio County, Texas | ||||||||||
|---|---|---|---|---|---|---|---|---|---|---|
| ||||||||||
Municipalities and communities of San Patricio County, Texas, United States | ||
|---|---|---|
| Cities | San Patricio County map | |
| Towns | ||
| CDPs | ||
| Footnotes | ‡This populated place also has portions in an adjacent county or counties | |
| ||

| Authority control |
|---|