Nueces County, Texas
Nueces County is a county in the U.S. state of Texas. As of the 2010 census, the population was 340,223, making it the 14th-most populous county in the state. [1] The county seat is Corpus Christi.[2] The county was formed in 1846 from portions of San Patricio County and organized the following year.[3] It is named for the Nueces River, which marks the county's northwestern boundary with San Patricio County before emptying into its mouth at Nueces Bay north of the port of Corpus Christi. Nueces County is part of the Corpus Christi metropolitan statistical area.
Nueces County | |
|---|---|
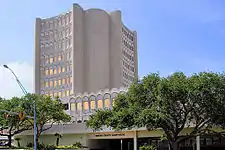 The Nueces County Courthouse in Corpus Christi | |
 Seal | |
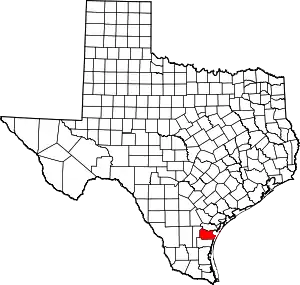 Location within the U.S. state of Texas | |
 Texas's location within the U.S. | |
| Coordinates: 27°44′N 97°31′W | |
| Country | |
| State | |
| Founded | 1847 |
| Named for | Nueces River |
| Seat | Corpus Christi |
| Largest city | Corpus Christi |
| Area | |
| • Total | 1,166 sq mi (3,020 km2) |
| • Land | 838 sq mi (2,170 km2) |
| • Water | 327 sq mi (850 km2) 28%% |
| Population (2010) | |
| • Total | 340,223 |
| • Density | 406/sq mi (157/km2) |
| Time zone | UTC−6 (Central) |
| • Summer (DST) | UTC−5 (CDT) |
| Congressional district | 27th |
| Website | www |
Geography
According to the U.S. Census Bureau, the county has an area of 1,166 square miles (3,020 km2), of which 838 square miles (2,170 km2) are land and 327 square miles (850 km2) (28%) are covered by water.[4] It borders the Gulf of Mexico.
Major highways
.svg.png.webp) Interstate 37
Interstate 37.svg.png.webp) Interstate 69E (Under Construction)
Interstate 69E (Under Construction) U.S. Highway 77
 U.S. Highway 181
 State Highway 35
 State Highway 44
 State Highway 286
 State Highway 357
 Farm to Market Road 43
 Farm to Market Road 70
 Farm to Market Road 624
 Farm to Market Road 665
 Farm to Market Road 666
Adjacent counties
- San Patricio County (north)
- Kleberg County (south)
- Jim Wells County (west)
- Aransas County (northeast)
Demographics
| Historical population | |||
|---|---|---|---|
| Census | Pop. | %± | |
| 1850 | 698 | — | |
| 1860 | 2,906 | 316.3% | |
| 1870 | 3,975 | 36.8% | |
| 1880 | 7,673 | 93.0% | |
| 1890 | 8,093 | 5.5% | |
| 1900 | 10,439 | 29.0% | |
| 1910 | 21,955 | 110.3% | |
| 1920 | 22,807 | 3.9% | |
| 1930 | 51,779 | 127.0% | |
| 1940 | 92,661 | 79.0% | |
| 1950 | 165,471 | 78.6% | |
| 1960 | 221,573 | 33.9% | |
| 1970 | 237,544 | 7.2% | |
| 1980 | 268,215 | 12.9% | |
| 1990 | 291,145 | 8.5% | |
| 2000 | 313,645 | 7.7% | |
| 2010 | 340,223 | 8.5% | |
| 2019 (est.) | 362,294 | [5] | 6.5% |
| U.S. Decennial Census[6] 1850–2010[7] 2010–2019[1] | |||
As of the census[8] of 2000, 313,645 people, 110,365 households, and 79,683 families resided in the county. The population density was 375 people per square mile (145/km2). The 123,041 housing units averaged 147 per square mile (57/km2). The racial makeup of the county was 72.03% White, 4.24% African American, 0.64% Native American, 1.16% Asian, 0.07% Pacific Islander, 18.74% from other races, and 3.13% from two or more races. About 55.78% of the population was Hispanic or Latino of any race.
Of the 110,365 households, 36.30% had children under the age of 18 living with them, 51.80% were married couples living together, 15.30% had a female householder with no husband present, and 27.80% were not families. About 22.60% of all households were made up of individuals, and 7.90% had someone living alone who was 65 years of age or older. The average household size was 2.79 and the average family size was 3.30.
In the county, the age distribution was 28.40% under the age of 18, 10.50% from 18 to 24, 28.90% from 25 to 44, 21.10% from 45 to 64, and 11.20% who were 65 years of age or older. The median age was 33 years. For every 100 females, there were 95.80 males. For every 100 females age 18 and over, there were 92.50 males.
The median income for a household in the county was $35,959, and for a family was $41,066. Males had a median income of $31,571 versus $22,324 for females. The per capita income for the county was $17,036. About 14.70% of families and 18.20% of the population were below the poverty line, including 24.00% of those under age 18 and 15.80% of those age 65 or over.
Communities
Cities (multiple counties)
- Aransas Pass (partly in San Patricio and Aransas Counties)
- Corpus Christi (county seat) (San Patricio and Aransas Counties)
- Ingleside (mostly in San Patricio County)
- Portland (mostly in San Patricio County)
- San Patricio (mostly in San Patricio County)
Census-designated places
Unincorporated communities
Politics
Historically, Nueces County leaned Democratic in presidential elections, though in recent years has narrowly voted Republican. Dwight D. Eisenhower in 1952 became the first Republican candidate to carry the county. Prior to that year, the only times Nueces County did not vote for the national Democratic candidate was in its first presidential election in 1848 for Whig Zachary Taylor, and in 1860, supporting Southern Democratic John C. Breckinridge. Since Eisenhower's election, the only other Republicans to carry the county in the 20th century were Richard Nixon in 1972 and Ronald Reagan in 1984. So far, Bill Clinton remains the last Democratic candidate to win Nueces County, having done so in 1996.
Since 2000, Nueces County has voted for every Republican presidential candidate, with only George W. Bush in 2004 having carried it by a double digit margin, and his 56.8% of the vote is also the highest for any Republican in the county's history. In 2016, Donald Trump defeated Hillary Clinton in the county with a plurality of 48.6% to 47.1%, or 1,568 votes, the closest race since 1956. In 2020, Trump won the county again with a majority and a stronger, but still narrow, margin.
Democratic strength is concentrated within the inland portion of the county, with particular strengths in downtown Corpus Christi plus the city's heavily Hispanic neighborhoods, Robstown, and communities in the western part of the county. Republicans generally do well with areas closer to the coast, particularly in the southeast suburb of Corpus Christi, Flour Bluff, and Port Aransas.[9]
| Year | Republican | Democratic | Third parties |
|---|---|---|---|
| 2020 | 50.8% 64,617 | 47.8% 60,925 | 1.4% 1,780 |
| 2016 | 48.6% 50,766 | 47.1% 49,198 | 4.3% 4,441 |
| 2012 | 51.0% 48,966 | 47.6% 45,772 | 1.4% 1,366 |
| 2008 | 51.8% 52,391 | 47.3% 47,912 | 0.9% 927 |
| 2004 | 56.8% 59,359 | 42.5% 44,439 | 0.7% 762 |
| 2000 | 51.3% 49,906 | 46.6% 45,349 | 2.1% 2,071 |
| 1996 | 40.2% 37,470 | 53.7% 50,009 | 6.1% 5,689 |
| 1992 | 36.5% 36,781 | 46.0% 46,317 | 17.6% 17,693 |
| 1988 | 48.3% 46,337 | 51.3% 49,209 | 0.4% 386 |
| 1984 | 53.7% 54,333 | 46.2% 46,721 | 0.2% 159 |
| 1980 | 46.8% 40,586 | 50.1% 43,424 | 3.0% 2,634 |
| 1976 | 38.0% 32,797 | 61.1% 52,755 | 0.9% 773 |
| 1972 | 55.4% 41,682 | 44.2% 33,277 | 0.4% 291 |
| 1968 | 31.6% 21,307 | 57.8% 39,025 | 10.6% 7,159 |
| 1964 | 25.8% 14,048 | 74.1% 40,426 | 0.2% 84 |
| 1960 | 39.1% 18,907 | 60.7% 29,361 | 0.2% 100 |
| 1956 | 49.9% 19,985 | 49.7% 19,912 | 0.4% 162 |
| 1952 | 48.6% 19,124 | 51.2% 20,156 | 0.2% 79 |
| 1948 | 25.6% 5,577 | 70.0% 15,240 | 4.4% 966 |
| 1944 | 24.2% 3,819 | 70.3% 11,091 | 5.5% 863 |
| 1940 | 23.9% 3,065 | 75.8% 9,740 | 0.3% 37 |
| 1936 | 15.5% 1,234 | 83.1% 6,597 | 1.4% 109 |
| 1932 | 12.6% 967 | 86.9% 6,659 | 0.5% 36 |
| 1928 | 45.4% 2,481 | 54.6% 2,985 | 0.1% 3 |
| 1920 | 21.6% 383 | 70.1% 1,246 | 8.3% 148 |
| 1916 | 16.9% 404 | 76.4% 1,830 | 6.8% 163 |
| 1912 | 6.5% 85 | 69.6% 910 | 23.9% 312 |
See also
References
- "State & County QuickFacts". United States Census Bureau. Archived from the original on October 18, 2011. Retrieved December 22, 2013.
- "Find a County". National Association of Counties. Retrieved 2011-06-07.
- "Texas: Individual County Chronologies". Texas Atlas of Historical County Boundaries. The Newberry Library. 2008. Retrieved May 25, 2015.
- "2010 Census Gazetteer Files". United States Census Bureau. August 22, 2012. Retrieved May 5, 2015.
- "Population and Housing Unit Estimates". United States Census Bureau. May 24, 2020. Retrieved May 27, 2020.
- "U.S. Decennial Census". United States Census Bureau. Retrieved May 5, 2015.
- "Texas Almanac: Population History of Counties from 1850–2010" (PDF). Texas Almanac. Retrieved May 5, 2015.
- "U.S. Census website". United States Census Bureau. Retrieved 2011-05-14.
- Rohla, Ryne. "2016 Presidential General Election Maps". Ryne Rohla.
- Leip, David. "Dave Leip's Atlas of U.S. Presidential Elections". uselectionatlas.org. Retrieved 6 April 2018.
External links
| Wikimedia Commons has media related to Nueces County, Texas. |
- Nueces County government's website
- Nueces County in Handbook of Texas Online at the University of Texas
- Historic Nueces County materials, hosted by the Portal to Texas History.
Places adjacent to Nueces County, Texas | ||||||||||
|---|---|---|---|---|---|---|---|---|---|---|
| ||||||||||
Municipalities and communities of Nueces County, Texas, United States | ||
|---|---|---|
| Cities | Nueces County map | |
| CDPs | ||
| Other unincorporated communities | ||
| Footnotes | ‡This populated place also has portions in an adjacent county or counties | |
| ||

City of Corpus Christi | ||||||
|---|---|---|---|---|---|---|
| ||||||
| Education |
|  | ||||
| Military | ||||||
| Parks and Recreation | ||||||
| Sports | ||||||
| Tourism | ||||||
| Transportation | ||||||
| Government | ||||||
| Authority control |
|---|