Shackelford County, Texas
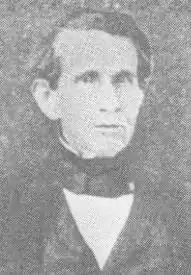
Shackelford County is a county located in the U.S. state of Texas. As of the 2010 census, its population was 3,378.[1] Its county seat is Albany.[2] The county was created in 1858 and later organized in 1874.[3] Shackelford is named for Dr. Jack Shackelford, a Virginia physician who equipped soldiers at his own expense to fight in the Texas Revolution.
Shackelford County | |
|---|---|
 The Shackelford County Courthouse in Albany | |
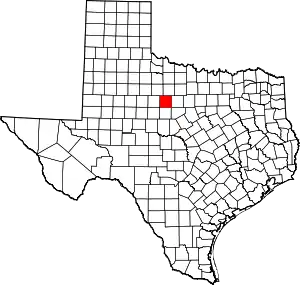 Location within the U.S. state of Texas | |
 Texas's location within the U.S. | |
| Coordinates: 32°44′N 99°21′W | |
| Country | |
| State | |
| Founded | 1874 |
| Named for | Jack Shackelford |
| Seat | Albany |
| Largest city | Albany |
| Area | |
| • Total | 916 sq mi (2,370 km2) |
| • Land | 914 sq mi (2,370 km2) |
| • Water | 1.3 sq mi (3 km2) 0.1%% |
| Population (2010) | |
| • Total | 3,378 |
| • Density | 3.7/sq mi (1.4/km2) |
| Time zone | UTC−6 (Central) |
| • Summer (DST) | UTC−5 (CDT) |
| Congressional district | 19th |
Historic Fort Griffin, established in 1867, lies within Shackelford County.
During the last two weekends of June, the Fort Griffin Fandangle, a western musical production, is presented by Shackelford County residents in the Prairie Theater in Albany. The content of the program is changed each year. Begun in 1938, it is billed as "Texas' Oldest Outdoor Musical".
Geography
According to the U.S. Census Bureau, the county has a total area of 916 square miles (2,370 km2), of which 914 square miles (2,370 km2) is land and 1.3 square miles (3.4 km2) (0.1%) is water.[4]
Major highways
 U.S. Highway 180
 U.S. Highway 283
 State Highway 6
 State Highway 351
Adjacent counties
- Throckmorton County (north)
- Stephens County (east)
- Eastland County (southeast)
- Callahan County (south)
- Jones County (west)
- Haskell County (northwest)
- Taylor County (southwest)
Demographics
| Historical population | |||
|---|---|---|---|
| Census | Pop. | %± | |
| 1860 | 44 | — | |
| 1870 | 455 | 934.1% | |
| 1880 | 2,037 | 347.7% | |
| 1890 | 2,012 | −1.2% | |
| 1900 | 2,461 | 22.3% | |
| 1910 | 4,201 | 70.7% | |
| 1920 | 4,960 | 18.1% | |
| 1930 | 6,695 | 35.0% | |
| 1940 | 6,211 | −7.2% | |
| 1950 | 5,001 | −19.5% | |
| 1960 | 3,990 | −20.2% | |
| 1970 | 3,323 | −16.7% | |
| 1980 | 3,915 | 17.8% | |
| 1990 | 3,316 | −15.3% | |
| 2000 | 3,302 | −0.4% | |
| 2010 | 3,378 | 2.3% | |
| 2019 (est.) | 3,265 | [5] | −3.3% |
| U.S. Decennial Census[6] 1850–2010[7] 2010–2014[1] | |||
As of the census[8] of 2000, there were 3,302 people, 1,300 households, and 941 families residing in the county. The population density was 4 people per square mile (1/km2). There were 1,613 housing units at an average density of 2 per square mile (1/km2). The racial makeup of the county was 94.22% White, 0.48% Black or African American, 0.42% Native American, 4.24% from other races, and 0.64% from two or more races. 7.60% of the population were Hispanic or Latino of any race.
There were 1,300 households, out of which 32.80% had children under the age of 18 living with them, 60.90% were married couples living together, 8.70% had a female householder with no husband present, and 27.60% were non-families. 26.20% of all households were made up of individuals, and 14.60% had someone living alone who was 65 years of age or older. The average household size was 2.49 and the average family size was 3.02.
In the county, the population was spread out, with 26.70% under the age of 18, 6.00% from 18 to 24, 24.80% from 25 to 44, 24.30% from 45 to 64, and 18.20% who were 65 years of age or older. The median age was 40 years. For every 100 females there were 90.10 males. For every 100 females age 18 and over, there were 85.50 males.
The median income for a household in the county was $30,479, and the median income for a family was $38,447. Males had a median income of $26,953 versus $19,766 for females. The per capita income for the county was $16,341. About 10.90% of families and 13.60% of the population were below the poverty line, including 15.80% of those under age 18 and 16.90% of those age 65 or over.
Education
Shackelford County includes these school districts:
Communities
Cities
- Albany (county seat)
- Lueders (mostly in Jones County)
- Moran
See also
Politics
| Year | Republican | Democratic | Third parties |
|---|---|---|---|
| 2020 | 91.2% 1,484 | 8.0% 130 | 0.9% 14 |
| 2016 | 91.6% 1,378 | 6.9% 103 | 1.5% 23 |
| 2012 | 89.4% 1,218 | 9.6% 131 | 1.0% 14 |
| 2008 | 85.3% 1,284 | 13.8% 208 | 0.9% 13 |
| 2004 | 84.6% 1,292 | 15.0% 229 | 0.4% 6 |
| 2000 | 79.1% 1,066 | 19.6% 264 | 1.3% 17 |
| 1996 | 53.8% 792 | 34.1% 502 | 12.0% 177 |
| 1992 | 40.6% 623 | 31.6% 484 | 27.8% 426 |
| 1988 | 55.7% 865 | 43.8% 681 | 0.5% 8 |
| 1984 | 73.6% 1,181 | 25.9% 415 | 0.5% 8 |
| 1980 | 60.7% 959 | 38.3% 606 | 1.0% 16 |
| 1976 | 49.3% 748 | 50.3% 764 | 0.4% 6 |
| 1972 | 73.1% 909 | 26.6% 331 | 0.3% 4 |
| 1968 | 37.0% 557 | 44.7% 673 | 18.4% 277 |
| 1964 | 34.2% 487 | 65.6% 934 | 0.2% 3 |
| 1960 | 49.0% 684 | 51.0% 713 | |
| 1956 | 60.3% 849 | 39.4% 555 | 0.4% 5 |
| 1952 | 57.5% 1,057 | 42.2% 776 | 0.2% 4 |
| 1948 | 18.4% 211 | 77.8% 892 | 3.8% 43 |
| 1944 | 10.1% 135 | 75.2% 1,007 | 14.7% 197 |
| 1940 | 13.1% 229 | 86.8% 1,521 | 0.2% 3 |
| 1936 | 11.7% 152 | 88.4% 1,153 | |
| 1932 | 8.1% 117 | 91.5% 1,316 | 0.4% 5 |
| 1928 | 51.1% 558 | 48.8% 533 | 0.1% 1 |
| 1924 | 49.9% 727 | 50.1% 729 | |
| 1920 | 22.0% 116 | 64.9% 342 | 13.1% 69 |
| 1916 | 10.9% 51 | 80.9% 378 | 8.1% 38 |
| 1912 | 5.3% 18 | 72.4% 246 | 22.4% 76 |
References
- "State & County QuickFacts". United States Census Bureau. Retrieved December 24, 2013.
- "Find a County". National Association of Counties. Retrieved 2011-06-07.
- "Texas: Individual County Chronologies". Texas Atlas of Historical County Boundaries. The Newberry Library. 2008. Retrieved May 26, 2015.
- "2010 Census Gazetteer Files". United States Census Bureau. August 22, 2012. Retrieved May 10, 2015.
- "Population and Housing Unit Estimates". United States Census Bureau. May 24, 2020. Retrieved May 27, 2020.
- "U.S. Decennial Census". United States Census Bureau. Retrieved May 10, 2015.
- "Texas Almanac: Population History of Counties from 1850–2010" (PDF). Texas Almanac. Retrieved May 10, 2015.
- "U.S. Census website". United States Census Bureau. Retrieved 2011-05-14.
- Leip, David. "Dave Leip's Atlas of U.S. Presidential Elections". uselectionatlas.org. Retrieved 2018-07-30.
External links
![]() Media related to Shackelford County, Texas at Wikimedia Commons
Media related to Shackelford County, Texas at Wikimedia Commons
- Shackelford County from the Handbook of Texas Online
- Texas Genealogy & History
- Shackelford County Government Website
- Shackelford County Profile from the Texas Association of Counties
Places adjacent to Shackelford County, Texas | ||||||||||
|---|---|---|---|---|---|---|---|---|---|---|
| ||||||||||
Municipalities and communities of Shackelford County, Texas, United States | ||
|---|---|---|
| Cities | Shackelford County map | |
| Footnotes | ‡This populated place also has portions in an adjacent county or counties | |
| ||

| Authority control |
|---|