Andrews County, Texas
Andrews County is a county in the U.S. state of Texas. As of the 2010 census, the population was 14,786.[1] Its county seat is Andrews.[2] Andrews is named for Richard Andrews, a soldier of the Texas Revolution. The county was created August 21, 1876, from Tom Green County and organized in 1910.[3]
Andrews County | |
|---|---|
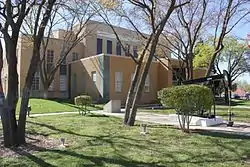 Andrews County Courthouse in Andrews | |
 Location within the U.S. state of Texas | |
 Texas's location within the U.S. | |
| Coordinates: 32°18′N 102°38′W | |
| Country | |
| State | |
| Founded | 1910 |
| Named for | Richard Andrews |
| Seat | Andrews |
| Largest city | Andrews |
| Area | |
| • Total | 1,501 sq mi (3,890 km2) |
| • Land | 1,501 sq mi (3,890 km2) |
| • Water | 0.4 sq mi (1 km2) 0.02%% |
| Population | |
| • Estimate (2019) | 18,705 |
| • Density | 11.8/sq mi (4.6/km2) |
| Time zone | UTC−6 (Central) |
| • Summer (DST) | UTC−5 (CDT) |
| Congressional district | 11th |
| Website | www |
The Andrews Micropolitan Statistical Area includes all of Andrews County.
Andrews County was represented in the Texas House of Representatives by George E. "Buddy" West from 1993 to June 25, 2008, when he died. He was succeeded in January 2009 by fellow Republican Tryon D. Lewis, who had defeated West for the Republican nomination in the April 8, 2008, primary election.
Geography
According to the U.S. Census Bureau, the county has an area of 1,501 square miles (3,890 km2), of which 1,501 square miles (3,890 km2) is land and 0.4 square miles (1.0 km2) (0.02%) is water.[4] The county contains many playa lakes, the two largest being Baird lake and Shafter Lake.
In the west part of Andrews County on the border with New Mexico (see the state border issue below), a private company, Waste Control Specialists (WCS), formerly owned by the late Harold Simmons and headquartered in Dallas, Texas, operates a 14,000 acres (57 km2) site. The company was awarded a license to dispose of radioactive waste by the TCEQ in 2009. The permit allows for disposal of radioactive materials such as uranium, plutonium and thorium from commercial power plants, academic institutions and medical schools.[5] The company finished construction on the project in 2011 and began disposing of waste in 2012. There are two radioactive waste landfills at the site. The 30-acre compact site is owned and regulated by the State of Texas for use by Texas, Vermont, and up to 36 other states. The 90-acre federal site is owned by the United States federal government and is used for Department of Energy and other federal waste.[5] The company employs 130 people or about 1% of the total labor force in Andrews and Andrews County.[6]
For years there has been a simmering dispute over which state these waste sites are lawfully a part of: Texas or New Mexico? The straight north–south border between the two states was originally defined as the 103rd meridian, but the 1859 survey that was supposed to mark that boundary mistakenly set the border between 2.29 and 3.77 miles too far west of that line, making the Waste Control Specialists waste sites, which are west of the 103rd meridian, along with the current towns of Farwell, Texline, and part of Glenrio, appear to be within the State of Texas. New Mexico's short border with Oklahoma, in contrast, was surveyed on the correct meridian. New Mexico's draft constitution in 1910 stated that the border is on the 103rd meridian as intended. The disputed strip, hundreds of miles long, includes parts of valuable oilfields of the Permian Basin. A bill was passed in the New Mexico Senate to fund and file a lawsuit in the U.S. Supreme Court to recover the strip from Texas, but the bill did not become law. Today, land in the strip is included in Texas land surveys and the waste sites for all purposes are taxed and governed by Andrews County and The State of Texas.[7]
Adjacent counties
- Gaines County (north)
- Martin County (east)
- Midland County (southeast)
- Ector County (south)
- Winkler County (southwest)
- Lea County, New Mexico (west/Mountain Time Zone)
Demographics
| Historical population | |||
|---|---|---|---|
| Census | Pop. | %± | |
| 1890 | 24 | — | |
| 1900 | 87 | 262.5% | |
| 1910 | 975 | 1,020.7% | |
| 1920 | 350 | −64.1% | |
| 1930 | 736 | 110.3% | |
| 1940 | 1,277 | 73.5% | |
| 1950 | 5,002 | 291.7% | |
| 1960 | 13,450 | 168.9% | |
| 1970 | 10,372 | −22.9% | |
| 1980 | 13,323 | 28.5% | |
| 1990 | 14,338 | 7.6% | |
| 2000 | 13,004 | −9.3% | |
| 2010 | 14,786 | 13.7% | |
| 2019 (est.) | 18,705 | [8] | 26.5% |
| U.S. Decennial Census[9] 1850–2010[10] 2010–2014[1] | |||
As of the census of 2010, there were 14,786 people living in the county. 79.5% were White, 1.5% Black or African American, 1.0% Native American, 0.6% Asian, 15.5% of some other race and 2.0% of two or more races. 48.7% were Hispanic or Latino (of any race).
As of the census[11] of 2000, there were 13,004 people, 4,601 households, and 3,519 families living in the county. The population density was 9 people per square mile (3/km2). There were 5,400 housing units at an average density of 4 per square mile (1/km2). The racial makeup of the county was 77.08% White, 1.65% Black or African American, 0.88% Native American, 0.71% Asian, 0.02% Pacific Islander, 16.79% from other races, and 2.87% from two or more races. 40.00% of the population are Hispanic or Latino of any race.
There were 4,601 households, out of which 40.70% had children under the age of 18 living with them, 63.70% were married couples living together, 9.50% had a female householder with no husband present, and 23.50% were non-families. 21.80% of all households were made up of individuals, and 10.00% had someone living alone who was 65 years of age or older. The average household size was 2.81 and the average family size was 3.29.
In the county, the population was spread out, with 31.50% under the age of 18, 8.10% from 18 to 24, 27.30% from 25 to 44, 20.50% from 45 to 64, and 12.50% who were 65 years of age or older. The median age was 34 years. For every 100 females there were 96.30 males. For every 100 females age 18 and over, there were 91.20 males.
The median income for a household in the county was $34,036, and the median income for a family was $37,017. Males had a median income of $33,223 versus $21,846 for females. The per capita income for the county was $15,916. About 13.90% of families and 16.40% of the population were below the poverty line, including 20.20% of those under age 18 and 12.70% of those age 65 or over.
Education
The Andrews Independent School District serves all of Andrews County.
Media
The county is served by a weekly newspaper, local stations KACT AM and KACT-FM, nearby stations KBXJ (FM) and KPET (AM), and the various Midland and Odessa radio and TV stations.
Communities
City
- Andrews (county seat)
Census-designated place
Unincorporated communities
Ghost towns
- Coyote Corner
- Fasken
- Old Place Windmills
- Shafter Lake
- Sixteen Corner Windmill
- Waldon Place Windmill
Politics
| Year | Republican | Democratic | Third parties |
|---|---|---|---|
| 2020 | 84.3% 4,937 | 14.5% 849 | 1.2% 70 |
| 2016 | 79.5% 3,927 | 16.9% 836 | 3.6% 180 |
| 2012 | 81.2% 3,639 | 17.7% 795 | 1.1% 48 |
| 2008 | 82.4% 3,816 | 17.1% 790 | 0.5% 23 |
| 2004 | 84.6% 3,837 | 14.9% 677 | 0.5% 22 |
| 2000 | 76.8% 3,091 | 21.8% 876 | 1.4% 57 |
| 1996 | 59.0% 2,360 | 29.5% 1,181 | 11.5% 460 |
| 1992 | 53.6% 2,266 | 25.6% 1,081 | 20.8% 881 |
| 1988 | 72.8% 3,052 | 26.8% 1,122 | 0.4% 17 |
| 1984 | 82.5% 3,918 | 17.3% 820 | 0.3% 12 |
| 1980 | 69.8% 2,800 | 28.8% 1,155 | 1.4% 58 |
| 1976 | 54.0% 2,127 | 45.1% 1,777 | 0.8% 33 |
| 1972 | 79.0% 2,615 | 20.5% 677 | 0.5% 18 |
| 1968 | 38.5% 1,400 | 25.4% 922 | 36.1% 1,312 |
| 1964 | 40.2% 1,442 | 59.5% 2,133 | 0.3% 10 |
| 1960 | 45.5% 1,550 | 53.4% 1,821 | 1.1% 38 |
| 1956 | 53.5% 1,131 | 45.8% 968 | 0.7% 14 |
| 1952 | 46.6% 805 | 53.2% 920 | 0.2% 4 |
| 1948 | 10.6% 101 | 85.3% 816 | 4.2% 40 |
| 1944 | 11.9% 48 | 81.4% 329 | 6.7% 27 |
| 1940 | 5.6% 26 | 94.4% 440 | |
| 1936 | 5.9% 18 | 93.8% 287 | 0.3% 1 |
| 1932 | 3.1% 6 | 96.4% 186 | 0.5% 1 |
| 1928 | 72.5% 66 | 27.5% 25 | |
| 1924 | 9.9% 7 | 84.5% 60 | 5.6% 4 |
| 1920 | 10.8% 9 | 89.2% 74 | |
| 1916 | 0.0% 0 | 96.0% 71 | 4.1% 3 |
| 1912 | 1.2% 1 | 93.9% 77 | 4.9% 4 |
See also
References
- "State & County QuickFacts". United States Census Bureau. Archived from the original on July 6, 2011. Retrieved December 8, 2013.
- "Find a County". National Association of Counties. Archived from the original on 2011-05-31. Retrieved 2011-06-07.
- "Texas: Individual County Chronologies". Texas Atlas of Historical County Boundaries. The Newberry Library. 2008. Retrieved May 20, 2015.
- "2010 Census Gazetteer Files". United States Census Bureau. August 22, 2012. Retrieved April 18, 2015.
- https://abcnews.go.com/US/wireStory/texas-site-begins-taking-federal-nuclear-waste-19343196#.UblWMfk3vg0
- "Archived copy" (PDF). Archived from the original (PDF) on 2013-08-10. Retrieved 2013-06-13.CS1 maint: archived copy as title (link)
- Daniel Gertson. "Border War Brewing?". Retrieved 2016-09-24.
- "Population and Housing Unit Estimates". United States Census Bureau. May 24, 2020. Retrieved May 27, 2020.
- "U.S. Decennial Census". United States Census Bureau. Retrieved April 18, 2015.
- "Texas Almanac: Population History of Counties from 1850–2010" (PDF). Texas Almanac. Retrieved April 18, 2015.
- "U.S. Census website". United States Census Bureau. Retrieved 2011-05-14.
- Leip, David. "Dave Leip's Atlas of U.S. Presidential Elections". uselectionatlas.org. Retrieved 2018-07-19.
External links
- Andrews County government website
- Andrews County from the Handbook of Texas Online
- Andrews County from the Texas Almanac
- Andrews County from the TXGenWeb Project
- Andrews County Profile from the Texas Association of Counties
Places adjacent to Andrews County, Texas | ||||||||||
|---|---|---|---|---|---|---|---|---|---|---|
| ||||||||||
Municipalities and communities of Andrews County, Texas, United States | ||
|---|---|---|
| City | Andrews County map | |
| CDP | ||
| Other unincorporated communities | ||
| Ghost towns | ||
| ||

| Authority control |
|---|