McMullen County, Texas
McMullen County is a county located in the U.S. state of Texas. As of the 2010 census, its population was 707,[1] making it the fifth-least populous county in Texas. Its county seat is Tilden.[2] The county was established from parts of Bexar County, Atascosa County, and Live Oak County in 1858 and later organized in 1877.[3] It is named for John McMullen, founder of a colony in Texas.[4]
McMullen County | |
|---|---|
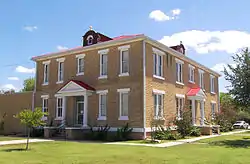 The McMullen County Courthouse in Tilden | |
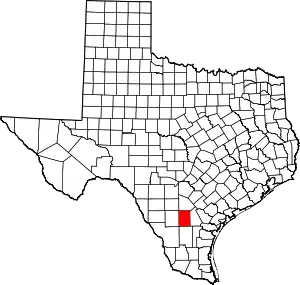 Location within the U.S. state of Texas | |
 Texas's location within the U.S. | |
| Coordinates: 28°21′N 98°34′W | |
| Country | |
| State | |
| Founded | 1877 |
| Named for | John McMullen |
| Seat | Tilden |
| Largest community | Tilden |
| Area | |
| • Total | 1,157 sq mi (3,000 km2) |
| • Land | 1,139 sq mi (2,950 km2) |
| • Water | 17 sq mi (40 km2) 1.5%% |
| Population (2010) | |
| • Total | 707 |
| • Density | 0.6/sq mi (0.2/km2) |
| Time zone | UTC−6 (Central) |
| • Summer (DST) | UTC−5 (CDT) |
| Congressional district | 28th |
| Website | www |
The McMullen County Courthouse was designed by the architect W.C. Stephenson, originally from Buffalo, New York. Stephenson also designed some fifty buildings in Beeville, including the Bee County Courthouse.
Geography
According to the U.S. Census Bureau, the county has a total area of 1,157 square miles (3,000 km2), of which 1,137 square miles (2,940 km2) is land and 17 square miles (44 km2) (1.5%) is water.[5]
Major highways
 State Highway 16
 State Highway 72
 State Highway 97
 Farm to Market Road 99
 Farm to Market Road 624
 Farm to Market Road 791
 Farm to Market Road 1582
Adjacent counties
- Atascosa County (north)
- Live Oak County (east)
- Duval County (south)
- La Salle County (west)
- Frio County (northwest)
Demographics
| Historical population | |||
|---|---|---|---|
| Census | Pop. | %± | |
| 1870 | 230 | — | |
| 1880 | 701 | 204.8% | |
| 1890 | 1,038 | 48.1% | |
| 1900 | 1,024 | −1.3% | |
| 1910 | 1,091 | 6.5% | |
| 1920 | 952 | −12.7% | |
| 1930 | 1,351 | 41.9% | |
| 1940 | 1,374 | 1.7% | |
| 1950 | 1,187 | −13.6% | |
| 1960 | 1,116 | −6.0% | |
| 1970 | 1,095 | −1.9% | |
| 1980 | 789 | −27.9% | |
| 1990 | 817 | 3.5% | |
| 2000 | 851 | 4.2% | |
| 2010 | 707 | −16.9% | |
| 2019 (est.) | 743 | [6] | 5.1% |
| U.S. Decennial Census[7] 1850–2010[8] 2010–2014[1] | |||
As of the census[9] of 2000, there were 851 people, 355 households, and 238 families residing in the county. The population density was less than 1/km2 (1/sq mi). There were 587 housing units at an average density of 0 per square mile (0/km2). The racial makeup of the county was 88.37% White, 1.18% Black or African American, 0.24% Native American, 8.93% from other races, and 1.29% from two or more races. 33.14% of the population were Hispanic or Latino of any race.
There were 355 households, out of which 25.90% had children under the age of 18 living with them, 59.70% were married couples living together, 5.60% had a female householder with no husband present, and 32.70% were non-families. 30.70% of all households were made up of individuals, and 14.90% had someone living alone who was 65 years of age or older. The average household size was 2.40 and the average family size was 3.01.
In the county, the population was spread out, with 23.40% under the age of 18, 6.30% from 18 to 24, 23.70% from 25 to 44, 28.70% from 45 to 64, and 17.90% who were 65 years of age or older. The median age was 43 years. For every 100 females there were 101.20 males. For every 100 females age 18 and over, there were 105.70 males.
The median income for a household in the county was $32,500, and the median income for a family was $35,417. Males had a median income of $26,953 versus $20,982 for females. The per capita income for the county was $22,258. 20.70% of the population and 15.90% of families were below the poverty line. Out of the total people living in poverty, 28.60% are under the age of 18 and 17.90% are 65 or older.
Education
McMullen County is served by the McMullen County Independent School District.
Communities
Census-designated place
- Tilden (county seat)
Unincorporated communities
- Calliham
- New Calliham
- Old Calliham
Politics
McMullen County is heavily Republican, having only voted for a Democratic candidate once since 1952, when in 1964 Texas native Lyndon B. Johnson won in a national landslide against Republican Barry Goldwater. In 2016 Donald Trump won 91.0% of the vote in McMullen County, the most lopsided result in the county since Franklin D. Roosevelt's victory in 1932.
| Year | Republican | Democratic | Third parties |
|---|---|---|---|
| 2016 | 91.0% 454 | 8.0% 40 | 1.0% 5 |
| 2012 | 85.7% 431 | 13.3% 67 | 1.0% 5 |
| 2008 | 74.5% 400 | 24.6% 132 | 0.9% 5 |
| 2004 | 82.8% 467 | 16.8% 95 | 0.4% 2 |
| 2000 | 81.6% 358 | 17.5% 77 | 0.9% 4 |
| 1996 | 63.7% 274 | 27.2% 117 | 9.1% 39 |
| 1992 | 61.9% 274 | 17.6% 78 | 20.5% 91 |
| 1988 | 75.9% 302 | 23.6% 94 | 0.5% 2 |
| 1984 | 84.7% 337 | 15.3% 61 | |
| 1980 | 68.1% 271 | 30.7% 122 | 1.3% 5 |
| 1976 | 52.8% 217 | 47.2% 194 | |
| 1972 | 76.8% 304 | 22.2% 88 | 1.0% 4 |
| 1968 | 39.5% 169 | 37.4% 160 | 23.1% 99 |
| 1964 | 39.5% 175 | 60.3% 267 | 0.2% 1 |
| 1960 | 50.1% 241 | 49.9% 240 | |
| 1956 | 54.7% 226 | 44.8% 185 | 0.5% 2 |
| 1952 | 64.9% 290 | 34.9% 156 | 0.2% 1 |
| 1948 | 20.2% 61 | 73.5% 222 | 6.3% 19 |
| 1944 | 28.3% 106 | 59.5% 223 | 12.3% 46 |
| 1940 | 18.6% 77 | 81.4% 336 | |
| 1936 | 12.3% 37 | 87.8% 265 | |
| 1932 | 4.4% 12 | 95.6% 258 | |
| 1928 | 50.0% 96 | 49.0% 94 | 1.0% 2 |
| 1924 | 49.8% 111 | 48.9% 109 | 1.4% 3 |
| 1920 | 31.1% 33 | 67.9% 72 | 0.9% 1 |
| 1916 | 20.1% 29 | 79.9% 115 | |
| 1912 | 14.5% 9 | 80.7% 50 | 4.8% 3 |
See also
References
- "State & County QuickFacts". United States Census Bureau. Archived from the original on October 18, 2011. Retrieved December 21, 2013.
- "Find a County". National Association of Counties. Retrieved 2011-06-07.
- "Texas: Individual County Chronologies". Texas Atlas of Historical County Boundaries. The Newberry Library. 2008. Retrieved May 25, 2015.
- Gannett, Henry (1905). The Origin of Certain Place Names in the United States. U.S. Government Printing Office. p. 195.
- "2010 Census Gazetteer Files". United States Census Bureau. August 22, 2012. Retrieved May 4, 2015.
- "Population and Housing Unit Estimates". United States Census Bureau. May 24, 2020. Retrieved May 27, 2020.
- "U.S. Decennial Census". United States Census Bureau. Retrieved May 4, 2015.
- "Texas Almanac: Population History of Counties from 1850–2010" (PDF). Texas Almanac. Retrieved May 4, 2015.
- "U.S. Census website". United States Census Bureau. Retrieved 2011-05-14.
- Leip, David. "Dave Leip's Atlas of U.S. Presidential Elections". uselectionatlas.org. Retrieved 2018-07-26.
External links
- McMullen County from the Handbook of Texas Online
- "McMullen County Profile" from the Texas Association of Counties
Places adjacent to McMullen County, Texas | ||||||||||
|---|---|---|---|---|---|---|---|---|---|---|
| ||||||||||
Municipalities and communities of McMullen County, Texas, United States | ||
|---|---|---|
| CDP | McMullen County map | |
| Other unincorporated community | ||
| ||
