Collin County, Texas
Collin County is located in the U.S. state of Texas. As of the 2010 United States Census, the county's population was 782,341,[1] making it the seventh-most populous county in Texas and the 45th-largest county by population in the United States. Per the American Community Survey's estimates, its population reached 1,034,730 in 2019.[2] Its county seat is McKinney.[3] Collin County is part of the Dallas-Fort Worth-Arlington metropolitan statistical area. A small portion of the city of Dallas is in the county.
Collin County | |
|---|---|
| Collin County | |
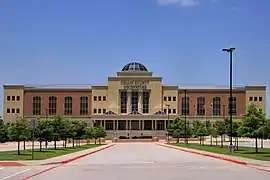 The Collin County Courthouse in McKinney | |
 Flag  Seal | |
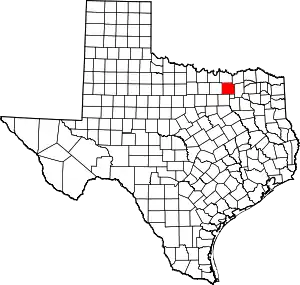 Location within the U.S. state of Texas | |
 Texas's location within the U.S. | |
| Coordinates: 33°11′N 96°35′W | |
| Country | |
| State | |
| Founded | 1846 |
| Named for | Collin McKinney |
| Seat | McKinney |
| Largest city | Plano |
| Area | |
| • Total | 886 sq mi (2,290 km2) |
| • Land | 841 sq mi (2,180 km2) |
| • Water | 45 sq mi (120 km2) 5.1%% |
| Population (2010) | |
| • Total | 782,341 |
| • Estimate (2019) | 1,034,730 |
| • Density | 1,153/sq mi (445/km2) |
| Time zone | UTC−6 (Central) |
| • Summer (DST) | UTC−5 (CDT) |
| Congressional districts | 3rd, 4th, 32nd |
| Website | www |
History
Both the county and the county seat were named after Collin McKinney[4] (1766-1861), one of the five men who drafted the Texas Declaration of Independence and the oldest of the 59 men who signed it.
Geography
According to the U.S. Census Bureau, the county has an area of 886 square miles (2,290 km2), of which 841 square miles (2,180 km2) is land and 45 square miles (120 km2) (5.1%) is covered by water.[5]
Lakes
Major highways
|
|
Neighboring counties
- Grayson County (north)
- Fannin County (northeast)
- Hunt County (east)
- Rockwall County (southeast)
- Dallas County (south)
- Denton County (west)
Demographics
| Historical population | |||
|---|---|---|---|
| Census | Pop. | %± | |
| 1850 | 1,950 | — | |
| 1860 | 9,264 | 375.1% | |
| 1870 | 14,013 | 51.3% | |
| 1880 | 25,983 | 85.4% | |
| 1890 | 36,736 | 41.4% | |
| 1900 | 50,087 | 36.3% | |
| 1910 | 49,021 | −2.1% | |
| 1920 | 49,609 | 1.2% | |
| 1930 | 46,180 | −6.9% | |
| 1940 | 47,190 | 2.2% | |
| 1950 | 41,692 | −11.7% | |
| 1960 | 41,247 | −1.1% | |
| 1970 | 66,920 | 62.2% | |
| 1980 | 144,576 | 116.0% | |
| 1990 | 264,036 | 82.6% | |
| 2000 | 491,675 | 86.2% | |
| 2010 | 782,341 | 59.1% | |
| 2019 (est.) | 1,034,730 | [6] | 32.3% |
| U.S. Decennial Census[7] 1850–2010[8] 2010–2019[1] | |||
2018 Texas Population Estimate Program
As of the 2018 Texas Population Estimate Program, the population of the county was 1,018,952. The racial makeup of the county was as follows: non-Hispanic whites 575,374 (56.47%), African Americans 97,396 (9.56%), Other non-Hispanic 176,377 (17.31%), & Hispanics and Latinos (of any race) 154,772 (15.19%).[9]
2010 Census
As of the census of 2010, there were 782,341 people.
According to U.S. Census figures released in 2006, the racial makeup of the county was as follows: 77.21% White, 7.26% African American, 10.02% Asian, 0.45% Native American, 5.06% of other or mixed race. 12.8% Hispanic of any race.
2000 Census
As of the census[10] of 2000, there were 491,675 people, 181,970 households, and 132,292 families residing in the county. The population density was 580 people per square mile (224/km2). There were 194,892 housing units at an average density of 230 per square mile (89/km2). The racial makeup of the county was 81.39% White, 4.79% Black or African American, 0.47% Native American, 6.92% Asian, 0.05% Pacific Islander, 4.26% from other races, and 2.11% from two or more races. 10.27% of the population were Hispanic or Latino of any race.
There were 181,970 households, out of which 40.60% had children under the age of 18 living with them, 62.10% were married couples living together, 7.50% had a female householder with no husband present, and 27.30% were non-families. 22.10% of all households were made up of individuals, and 3.10% had someone living alone who was 65 years of age or older. The average household size was 2.68 and the average family size was 3.18. As of the 2010 census, there were about 4.4 same-sex couples per 1,000 households in the county.[11]
In the county, the population was spread out, with 28.70% under the age of 18, 7.40% from 18 to 24, 37.90% from 25 to 44, 20.70% from 45 to 64, and 5.30% who were 65 years of age or older. The median age was 33 years. For every 100 females there were 99.80 males. For every 100 females age 18 and over, there were 97.80 males.
The median income for a household in the county was $70,835, and the median income for a family was $81,856 (these figures had risen to $77,671 and $91,881 respectively as of a 2007 estimate).[12] Males had a median income of $57,392 versus $36,604 for females. The per capita income for the county was $33,345. About 3.30% of families and 4.90% of the population were below the poverty line, including 5.10% of those under age 18 and 7.10% of those age 65 or over. Based on median household income, as of 2006, Collin County is the second richest county in Texas after Fort Bend, and is considered one of the wealthiest counties in the United States.
However, like other Texas counties, Collin County has one of the nation's highest property tax rates. In 2007, it was #21 for property taxes as percentage of the homes value on owner occupied housing.[13] It also ranked in the Top 100 for amount of property taxes paid and for percentage of taxes of income. Part of this is due to the Robin Hood plan school financing system in Texas.[14]
Government, courts, and politics
Government
Collin County, like all counties in Texas, is governed by a Commissioners Court. The court consists of the county judge (the chairperson of the Court), who is elected county-wide, and four commissioners who are elected by the voters in each of four precincts.[15]
County Commissioners[16]
| Office | Name | Party | |
|---|---|---|---|
| County Judge | Chris Hill | Republican | |
| Commissioner, Precinct 1 | Susan Fletcher | Republican | |
| Commissioner, Precinct 2 | Cheryl Williams | Republican | |
| Commissioner, Precinct 3 | Darrell Hale | Republican | |
| Commissioner, Precinct 4 | Duncan Webb | Republican | |
County Officials[16]
| Office | Name | Party | |
|---|---|---|---|
| County Clerk | Stacey Kemp | Republican | |
| Criminal District Attorney | Greg Willis | Republican | |
| District Clerk | Lynne Finley | Republican | |
| Sheriff | Jim Skinner | Republican | |
| Tax Assessor-Collector | Kenneth Maun | Republican | |
Politics
Collin County is a Republican stronghold in presidential and congressional elections. The last Democrat to win the county was Lyndon Johnson in 1964. Two factors caused Collin to swing hard to the Republican Party in the 1960s and 1970s: the party realignment brought about by the civil rights movement, and the expansion of the Dallas suburbs into Collin County. However, since the early 2000s, Collin County has been slowly moving towards the Democratic Party, particularly in Plano and Frisco. After giving George W. Bush over 70 percent in his two runs for president, it only gave John McCain 62 percent in 2008. Mitt Romney took 64 percent in 2012, but Donald Trump only got 55.2 percent in 2016, the lowest showing for a Republican in the county since 1968. Factors causing this shift include an influx of Democrat-voting younger professionals and families from Democrat-dominated states such as California, as well as a more diverse population (with increasing numbers of African-Americans along with recent immigrants and their children).
In spite of this shift, Republicans still control every countywide office and all of the overlapping seats in the State Legislature. Congressman Colin Allred, who represents its southern edge as part of the 32nd congressional district, is the only Democrat elected above the municipal level in any part of the county.
The county is considered a bellwether polity.[17]
Despite a Republican advantage, Collin continues to trend leftward, as Joe Biden managed 47.0% (to Donald Trump's 51.4%) in the 2020 presidential election, the best result for a losing Democrat since 1928 and the closest race since 1968. Many other suburban Texas counties, including its immediate neighbors in Denton County and Tarrant County as well as those around Houston and Austin, showed similar swings since 2016.
| Year | Republican | Democratic | Third parties |
|---|---|---|---|
| 2020 | 51.4% 252,318 | 47.0% 230,945 | 1.5% 7,593 |
| 2016 | 55.2% 201,014 | 38.6% 140,624 | 6.3% 22,792 |
| 2012 | 64.9% 196,888 | 33.4% 101,415 | 1.7% 5,264 |
| 2008 | 62.2% 184,897 | 36.7% 109,047 | 1.2% 3,513 |
| 2004 | 71.2% 174,435 | 28.1% 68,935 | 0.7% 1,784 |
| 2000 | 73.1% 128,179 | 24.5% 42,884 | 2.5% 4,357 |
| 1996 | 63.0% 83,750 | 28.5% 37,854 | 8.5% 11,321 |
| 1992 | 47.0% 60,514 | 19.0% 24,508 | 34.0% 43,811 |
| 1988 | 74.3% 67,776 | 25.1% 22,934 | 0.6% 520 |
| 1984 | 81.6% 61,095 | 18.2% 13,604 | 0.2% 139 |
| 1980 | 67.9% 36,559 | 28.2% 15,187 | 3.9% 2,115 |
| 1976 | 60.0% 21,608 | 39.0% 14,039 | 1.0% 353 |
| 1972 | 78.0% 17,667 | 21.1% 4,783 | 0.8% 187 |
| 1968 | 39.9% 6,494 | 36.4% 5,918 | 23.7% 3,850 |
| 1964 | 29.9% 3,341 | 70.0% 7,833 | 0.2% 19 |
| 1960 | 42.2% 3,865 | 57.1% 5,229 | 0.7% 64 |
| 1956 | 41.8% 3,823 | 57.8% 5,280 | 0.4% 34 |
| 1952 | 40.6% 4,037 | 59.4% 5,906 | 0.1% 7 |
| 1948 | 15.9% 1,155 | 76.1% 5,516 | 8.0% 579 |
| 1944 | 11.7% 974 | 78.8% 6,574 | 9.5% 796 |
| 1940 | 12.2% 1,028 | 87.7% 7,373 | 0.1% 11 |
| 1936 | 8.6% 531 | 91.3% 5,669 | 0.2% 10 |
| 1932 | 8.8% 589 | 90.5% 6,059 | 0.8% 50 |
| 1928 | 50.6% 3,476 | 49.1% 3,377 | 0.3% 23 |
| 1924 | 21.2% 1,981 | 77.0% 7,215 | 1.8% 169 |
| 1920 | 23.2% 1,338 | 70.0% 4,045 | 6.8% 395 |
| 1916 | 12.0% 594 | 83.9% 4,141 | 4.0% 198 |
| 1912 | 9.1% 342 | 84.6% 3,187 | 6.3% 239 |
State Board of Education member[19]
| District | Name | Party | |
|---|---|---|---|
| District 12 | Pam Little | Republican | |
Texas State Representatives[19]
| District | Name | Party | Residence | |
|---|---|---|---|---|
| District 33 | Justin Holland | Republican | Heath | |
| District 66 | Matt Shaheen | Republican | Plano | |
| District 67 | Jeff Leach | Republican | Plano | |
| District 70 | Scott Sanford | Republican | McKinney | |
| District 89 | Candy Noble | Republican | Lucas | |
Texas State Senators[19]
| District | Name | Party | Residence | |
|---|---|---|---|---|
| District 8 | Angela Paxton | Republican | N/A | |
| District 30 | Drew Springer | Republican | N/A | |
United States House of Representatives[19]
| District | Name | Party | Residence | |
|---|---|---|---|---|
| Texas's 3rd congressional district | Van Taylor | Republican | Plano | |
| Texas's 4th congressional district | Pat Fallon | Republican | ||
| Texas's 32nd congressional district | Colin Allred | Democrat | Dallas | |
Education
K-12 education
The following school districts lie entirely within Collin County:
- Allen Independent School District
- Anna Independent School District
- Farmersville Independent School District
- Lovejoy Independent School District
- McKinney Independent School District
- Melissa Independent School District
- Plano Independent School District
- Princeton Independent School District
- Wylie Independent School District
The following districts lie partly within the county:
- Bland Independent School District (very small part only)
- Blue Ridge Independent School District
- Celina Independent School District
- Community Independent School District
- Frisco Independent School District
- Leonard Independent School District (very small part only)
- Prosper Independent School District
- Royse City Independent School District
- Trenton Independent School District (very small part only)
- Van Alstyne Independent School District (very small part only)
- Whitewright Independent School District (very small part only)
In the 1990s Plano ISD received many non-Hispanic white families leaving urban areas. From circa 1997 and 2015 the number of non-Hispanic white children in K-12 schools in the county increased by 40,000 as part of a trend of white flight and suburbanization by non-Hispanic white families; however the same number of Plano ISD in particular decreased by 10,000 in that period.[20]
Colleges and universities
Collin College [21] opened its first campus on Highway 380 in McKinney in 1985. The college has grown to seven campuses/locations—two in McKinney and two in Plano and as well as Frisco, Allen and Rockwall. Dallas Baptist University [22] also has an extension site in Frisco, DBU Frisco. The majority of the University of Texas at Dallas campus in Richardson, Texas lies within Collin County.[23]
Parks
Media
Collin County is part of the Dallas/Fort Worth DMA. Local media outlets are: KDFW-TV, KXAS-TV, WFAA-TV, KTVT-TV, KERA-TV, KTXA-TV, KDFI-TV, KDAF-TV, and KFWD-TV. Other nearby stations that provide coverage for Collin County come from the Sherman/Denison market and they include: KTEN-TV and KXII-TV.
Newspapers in the Collin County area include the Allen American, Celina Record, Frisco Enterprise, McKinney Courier-Gazette, and the Plano Star-Courier. Nearby publications The Dallas Morning News and the Fort Worth Star-Telegram also provide news coverage of cities in the county.
Communities
Cities (multiple counties)
- Carrollton (mostly in Dallas and Denton counties)
- Celina (small part in Denton County)
- Dallas (mostly in Dallas County with small parts in Denton, Kaufman, Rockwall and Collin counties)
- Frisco (partly in Denton County)
- Garland (mostly in Dallas County and a small part in Rockwall County)
- Josephine (small part in Hunt County)
- Plano (small part in Denton County)
- Prosper (partly in Denton County)
- Richardson (mostly in Dallas County)
- Royse City (mostly in Rockwall County and partly Hunt County)
- Sachse (mostly in Dallas County)
- Van Alstyne (mostly in Grayson County)
- Wylie (small parts in Rockwall and Dallas counties)
Cities
- Allen
- Anna
- Blue Ridge
- Farmersville
- Lavon
- Lowry Crossing
- Lucas
- McKinney (County Seat)
- Melissa
- Murphy
- Nevada
- Parker
- Princeton
- Weston
Towns
- Fairview
- Hebron (mostly in Denton County)
- New Hope
- St. Paul
Census-designated place
Other unincorporated communities
- Altoga
- Arnold
- Beverly Hill
- Bloomdale
- Branch
- Buckner
- Chambersville
- Chambliss
- Clear Lake
- Climax
- Collin
- Copeville
- Cowley
- Culleoka
- Deep Water Point Estates
- Desert
- Fayburg
- Forest Grove
- Frognot
- Kelly
- Lavon Beach Estates
- Lavon Shores Estates
- Little Ridge
- Marilee
- Milligan
- Millwood
- New Mesquite
- Pebble Beach Sunset Acres
- Pecan Grove
- Pike
- Rhea Mills
- Rockhill
- Roland
- Sedalia
- Snow Hill
- Trinity Park
- Valdasta
- Verona
- Walnut Grove
- Wetsel
- Winningkoff
- Yucote Acres
Ghost towns
Notable people
- The Texas rancher and gunfighter King Fisher was born in Collin County in 1854.
- Frank Shelby Groner (1877-1943) Lawyer, pastor, and educator.
See also
References
- "State & County QuickFacts". United States Census Bureau. Archived from the original on July 8, 2011. Retrieved December 9, 2013.
- "Population and Housing Unit Estimates". Retrieved March 26, 2020.
- "Find a County". National Association of Counties. Archived from the original on 2011-05-31. Retrieved 2011-06-07.
- Gannett, Henry (1905). The Origin of Certain Place Names in the United States. Govt. Print. Off. p. 87.
- "2010 Census Gazetteer Files". United States Census Bureau. August 22, 2012. Retrieved April 21, 2015.
- "Population and Housing Unit Estimates". United States Census Bureau. May 24, 2020. Retrieved May 27, 2020.
- "U.S. Decennial Census". United States Census Bureau. Retrieved April 21, 2015.
- "Texas Almanac: Population History of Counties from 1850–2010" (PDF). Texas Almanac. Retrieved April 21, 2015.
- "Estimates of the Age, Sex, and Race/Ethnicity for State and Counties For July 1, 2018 For State Of Texas" (PDF). Texas Demographic Center. 2019-07-01. Retrieved 2020-08-10.
- "U.S. Census website". United States Census Bureau. Retrieved 2011-05-14.
- Leonhardt, David; Quealy, Kevin (June 26, 2015), "Where Same-Sex Couples Live", The New York Times, retrieved July 6, 2015
- Collin County, Texas - Fact Sheet - American FactFinder. Retrieved on 2009-05-21.
- "Tax Foundation". Tax Foundation.
- Postrel, Virginia (2004-10-07). "A Public Policy Failure". The New York Times.
- "Commissioners Court". www.collincountytx.gov. Retrieved 2017-11-03.
- "Government". www.collincountytx.gov. Retrieved 2017-12-04.
- David Wasserman (October 6, 2020), "The 10 Bellwether Counties That Show How Trump Is in Serious Trouble", Nytimes.com
- Leip, David. "Dave Leip's Atlas of U.S. Presidential Elections". uselectionatlas.org. Retrieved 2018-07-20.
- "Texas Redistricting". www.tlc.state.tx.us. Archived from the original on 2017-10-19. Retrieved 2017-11-03.
- Nicholson, Eric (2016-05-03). "In Dallas, White Flight Never Ends". Dallas Observer. Retrieved 2019-10-29.
- "Homepage - Collin College". www.collin.edu.
- "DBU website".
- "Archived copy". Archived from the original on 2012-11-19. Retrieved 2015-10-18.CS1 maint: archived copy as title (link)
External links
| Wikimedia Commons has media related to Collin County, Texas. |
- Collin County government's website
- 1846 Plat of Buckner the first county seat of Collin County, from the Collin County Historical Society, hosted by the Portal to Texas History
- Life in Collin County
- Collin County in Handbook of Texas Online at the University of Texas
- Collin Chronicles hosted by the Portal to Texas History
- Texas State Election History
- Collin County, Texas at Curlie
Places adjacent to Collin County, Texas | ||||||||||
|---|---|---|---|---|---|---|---|---|---|---|
| ||||||||||
Municipalities and communities of Collin County, Texas, United States | ||
|---|---|---|
| Cities | Collin County map | |
| Towns | ||
| CDP | ||
| Other unincorporated communities |
| |
| Historical communities | ||
| Ghost towns | ||
| Footnotes | ‡This populated place also has portions in an adjacent county or counties | |
| ||

| Authority control |
|---|