Newton County, Texas
Newton County is the easternmost county in the U.S. state of Texas. As of the 2010 census, its population was 14,445.[1] Its county seat is Newton.[2] The county is named for John Newton, a veteran of the American Revolutionary War.
Newton County | |
|---|---|
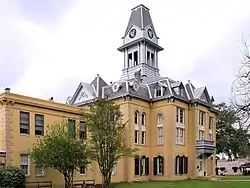 The Newton County Courthouse | |
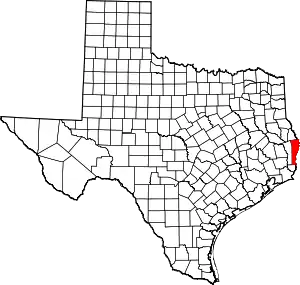 Location within the U.S. state of Texas | |
 Texas's location within the U.S. | |
| Coordinates: 30°47′N 93°45′W | |
| Country | |
| State | |
| Founded | 1846 |
| Named for | John Newton |
| Seat | Newton |
| Largest city | Newton |
| Area | |
| • Total | 940 sq mi (2,400 km2) |
| • Land | 934 sq mi (2,420 km2) |
| • Water | 6.1 sq mi (16 km2) 0.6%% |
| Population (2010) | |
| • Total | 14,445 |
| • Density | 15/sq mi (6/km2) |
| Time zone | UTC−6 (Central) |
| • Summer (DST) | UTC−5 (CDT) |
| Congressional district | 36th |
| Website | www |
Newton County is included in the Beaumont-Port Arthur Metropolitan Statistical Area.
As of 2000, it had the second-lowest population density for all counties in East Texas, behind only Red River County, and the lowest population density in Deep East Texas.
Geography
According to the U.S. Census Bureau, the county has a total area of 940 square miles (2,400 km2), of which 934 square miles (2,420 km2) is land and 6.1 square miles (16 km2) (0.6%) is covered by water.[3]
Major highways
Adjacent counties and parishes
- Sabine County (north)
- Vernon Parish, Louisiana (northeast)
- Beauregard Parish, Louisiana (east)
- Calcasieu Parish, Louisiana (southeast)
- Orange County (south)
- Jasper County (west)
Demographics
| Historical population | |||
|---|---|---|---|
| Census | Pop. | %± | |
| 1850 | 1,689 | — | |
| 1860 | 3,119 | 84.7% | |
| 1870 | 2,187 | −29.9% | |
| 1880 | 4,350 | 98.9% | |
| 1890 | 4,650 | 6.9% | |
| 1900 | 7,282 | 56.6% | |
| 1910 | 10,850 | 49.0% | |
| 1920 | 12,196 | 12.4% | |
| 1930 | 12,524 | 2.7% | |
| 1940 | 13,700 | 9.4% | |
| 1950 | 10,832 | −20.9% | |
| 1960 | 10,372 | −4.2% | |
| 1970 | 11,657 | 12.4% | |
| 1980 | 13,254 | 13.7% | |
| 1990 | 13,569 | 2.4% | |
| 2000 | 15,072 | 11.1% | |
| 2010 | 14,445 | −4.2% | |
| 2019 (est.) | 13,595 | [4] | −5.9% |
| U.S. Decennial Census[5] 1850–2010[6] 2010–2014[1] | |||
As of the census[7] of 2000, 15,072 people, 5,583 households, and 4,092 families resided in the county. The population density was 16 people per square mile (6/km2). The 7,331 housing units averaged 8 per square mile (3/km2). The racial makeup of the county was 75.84% White, 20.69% Black, 0.63% Native American, 0.27% Asian, 0.03% Pacific Islander, 1.56% from other races, and 0.98% from two or more races. About 3.79% of the population was Hispanic or Latino of any race.
Of the 5,583 households, 32.30% had children under the age of 18 living with them, 58.10% were married couples living together, 11.50% had a female householder with no husband present, and 26.70% were not families; 24.10% of all households were made up of individuals, and 10.50% had someone living alone who was 65 years of age or older. The average household size was 2.59 and the average family size was 3.07.
In the county, the population was distributed as 26.20% under the age of 18, 9.00% from 18 to 24, 26.60% from 25 to 44, 24.10% from 45 to 64, and 14.20% who were 65 years of age or older. The median age was 37 years. For every 100 females, there were 104.10 males. For every 100 females age 18 and over, there were 102.80 males.
The median income for a household in the county was $28,500, and for a family was $34,345. Males had a median income of $31,294 versus $17,738 for females. The per capita income for the county was $13,381. About 15.50% of families and 19.10% of the population were below the poverty line, including 24.40% of those under age 18 and 17.30% of those age 65 or over.
Politics
United States Congress
| Senators | Name | Party | First Elected | Level | |
|---|---|---|---|---|---|
| Senate Class 1 | John Cornyn | Republican | 1993 | Senior Senator | |
| Senate Class 2 | Ted Cruz | Republican | 2012 | Junior Senator | |
| Representatives | Name | Party | First Elected | Area(s) of Newton County Represented | |
| District 36 | Brian Babin | Republican | New district created with 2010 census. First elected 2014. | Entire county | |
Newton County was once one of the most Democratic-leaning counties in East Texas and the Deep South altogether. The county voted for the Democratic candidate in every election since Texas first participated in 1848 (excluding the 1860, 1864, and 1868 elections when Texas had seceded). Even when Republicans Herbert Hoover and Dwight D. Eisenhower carried Texas in 1928, 1952, and 1956, respectively, Newton County remained firmly Democrat.
The Democratic streak in Newton County was ended in 1968 when American Independent Party candidate George Wallace narrowly won the county with 42.6% of the vote against Democrat Hubert Humphrey's 41.7%. President Richard Nixon in 1972 became the first Republican to ever win the county in an election with 54% of the vote against Democrat George McGovern's 45.4%. After 1972, the county returned to voting Democrat, surviving the landslide elections of Republicans Ronald Reagan and George H. W. Bush in 1980, 1984, and 1988, respectively. In fact, Newton County was Walter Mondale's strongest county in East Texas in the 1984 election, winning 60.6% of the vote, and one of only four in the region to vote for him. Michael Dukakis in 1988 remains the last Democratic presidential candidate to win over 60% of the vote in the county.[8]
Since 1992, the Democratic percentage in Newton County has decreased in every election, culminating in Al Gore's narrow win in 2000 with 50.16% against Governor George W. Bush's 48.56%. As of 2016, Gore remains the last Democrat to win the county's votes in a presidential election. Since 2004, the Republican candidate has comfortably carried the county in every election, with Bush winning 55.42% in 2004, John McCain winning 65.51% in 2008, and Mitt Romney winning 70.06% in 2012.[8]
Political Culture
| Year | Republican | Democratic | Third parties |
|---|---|---|---|
| 2020 | 80.1% 4,882 | 19.3% 1,173 | 0.6% 39 |
| 2016 | 77.5% 4,288 | 20.9% 1,156 | 1.6% 90 |
| 2012 | 70.1% 4,112 | 28.6% 1,677 | 1.4% 80 |
| 2008 | 65.5% 3,446 | 33.3% 1,751 | 1.2% 63 |
| 2004 | 55.4% 3,159 | 44.1% 2,513 | 0.5% 28 |
| 2000 | 48.6% 2,423 | 50.2% 2,503 | 1.3% 64 |
| 1996 | 31.6% 1,409 | 57.3% 2,554 | 11.1% 493 |
| 1992 | 22.0% 1,212 | 59.0% 3,249 | 19.0% 1,047 |
| 1988 | 31.3% 1,659 | 68.6% 3,640 | 0.2% 10 |
| 1984 | 39.0% 2,123 | 60.6% 3,296 | 0.4% 20 |
| 1980 | 29.3% 1,379 | 69.7% 3,284 | 1.1% 51 |
| 1976 | 22.5% 1,011 | 77.0% 3,468 | 0.5% 23 |
| 1972 | 54.0% 1,946 | 45.4% 1,636 | 0.6% 23 |
| 1968 | 15.7% 555 | 41.7% 1,476 | 42.7% 1,510 |
| 1964 | 25.0% 738 | 74.8% 2,211 | 0.2% 6 |
| 1960 | 29.2% 756 | 70.1% 1,815 | 0.7% 19 |
| 1956 | 49.6% 1,030 | 50.0% 1,037 | 0.4% 9 |
| 1952 | 36.0% 917 | 64.0% 1,630 | 0.0% 1 |
| 1948 | 7.9% 110 | 68.4% 957 | 23.7% 332 |
| 1944 | 15.3% 187 | 74.4% 910 | 10.4% 127 |
| 1940 | 8.2% 174 | 91.7% 1,940 | 0.1% 2 |
| 1936 | 7.7% 93 | 92.1% 1,111 | 0.2% 2 |
| 1932 | 2.8% 46 | 97.0% 1,586 | 0.2% 3 |
| 1928 | 41.3% 397 | 58.6% 564 | 0.1% 1 |
| 1924 | 15.3% 145 | 82.5% 782 | 2.2% 21 |
| 1920 | 8.7% 58 | 62.9% 420 | 28.4% 190 |
| 1916 | 6.1% 34 | 88.4% 493 | 5.6% 31 |
| 1912 | 3.1% 11 | 78.8% 278 | 18.1% 64 |
See also
References
- "State & County QuickFacts". United States Census Bureau. Archived from the original on October 18, 2011. Retrieved December 22, 2013.
- "Find a County". National Association of Counties. Retrieved 2011-06-07.
- "2010 Census Gazetteer Files". United States Census Bureau. August 22, 2012. Retrieved May 5, 2015.
- "Population and Housing Unit Estimates". United States Census Bureau. May 24, 2020. Retrieved May 27, 2020.
- "U.S. Decennial Census". United States Census Bureau. Retrieved May 5, 2015.
- "Texas Almanac: Population History of Counties from 1850–2010" (PDF). Texas Almanac. Retrieved May 5, 2015.
- "U.S. Census website". United States Census Bureau. Retrieved 2011-05-14.
- http://uselectionatlas.org/RESULTS/
- Leip, David. "Dave Leip's Atlas of U.S. Presidential Elections". uselectionatlas.org. Retrieved 2018-07-28.
External links
| Wikimedia Commons has media related to Newton County, Texas. |
- Newton County government's website
- Newton County Public Health District The Public Health District Website for Newton County.
- Newton County from the Handbook of Texas Online
Places adjacent to Newton County, Texas | |
|---|---|
Municipalities and communities of Newton County, Texas, United States | ||
|---|---|---|
| City | Newton County map | |
| CDPs | ||
| Other unincorporated communities | ||
| Ghost towns | ||
| ||

| Authority control |
|---|