Mitchell County, Texas
Mitchell County is a county in the U.S. state of Texas. As of the 2010 census, its population was 9,403.[1] Its county seat is Colorado City.[2] The county was created in 1876 and organized in 1881.[3] It is named for Asa and Eli Mitchell, two early settlers and soldiers in the Texas Revolution.
Mitchell County | |
|---|---|
 The Mitchell County Courthouse in Colorado City | |
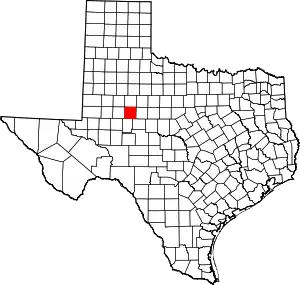 Location within the U.S. state of Texas | |
 Texas's location within the U.S. | |
| Coordinates: 32°18′N 100°55′W | |
| Country | |
| State | |
| Founded | 1881 |
| Seat | Colorado City |
| Largest city | Colorado City |
| Area | |
| • Total | 916 sq mi (2,370 km2) |
| • Land | 911 sq mi (2,360 km2) |
| • Water | 4.8 sq mi (12 km2) 0.5%% |
| Population (2010) | |
| • Total | 9,403 |
| • Density | 10/sq mi (4/km2) |
| Time zone | UTC−6 (Central) |
| • Summer (DST) | UTC−5 (CDT) |
| Congressional district | 11th |

Geography
According to the U.S. Census Bureau, the county has a total area of 916 square miles (2,370 km2), of which 911 square miles (2,360 km2) are land and 4.8 square miles (12 km2) (0.5%) are covered by water.[4] Mitchell County contains two reservoirs, Lake Colorado City and Lake Champion.
Major highways
.svg.png.webp) Interstate 20
Interstate 20 State Highway 163
 State Highway 208
 State Highway 350
Adjacent counties
- Scurry County (north)
- Nolan County (east)
- Coke County (southeast)
- Sterling County (south)
- Howard County (west)
- Borden County (northwest)
Demographics
| Historical population | |||
|---|---|---|---|
| Census | Pop. | %± | |
| 1880 | 117 | — | |
| 1890 | 2,059 | 1,659.8% | |
| 1900 | 2,855 | 38.7% | |
| 1910 | 8,956 | 213.7% | |
| 1920 | 7,527 | −16.0% | |
| 1930 | 14,183 | 88.4% | |
| 1940 | 12,477 | −12.0% | |
| 1950 | 14,357 | 15.1% | |
| 1960 | 11,255 | −21.6% | |
| 1970 | 9,073 | −19.4% | |
| 1980 | 9,088 | 0.2% | |
| 1990 | 8,016 | −11.8% | |
| 2000 | 9,698 | 21.0% | |
| 2010 | 9,403 | −3.0% | |
| 2019 (est.) | 8,545 | [5] | −9.1% |
| U.S. Decennial Census[6] 1850–2010[7] 2010–2014[1] | |||
As of the census[8] of 2000, 9,698 people, 2,837 households, and 1,997 families resided in the county. The population density was 11 people per square mile (4/km2). The 4,168 housing units averaged five per square mile (2/km2). The racial makeup of the county was 74.52% White, 12.81% Black or African American, 0.41% Native American, 0.36% Asian, 0.02% Pacific Islander, 10.19% from other races, and 1.69% from two or more races; 31.03% of the population was Hispanic or Latino of any race.
Of the 2,837 households, 30.60% had children under the age of 18 living with them, 55.60% were married couples living together, 11.40% had a female householder with no husband present, and 29.60% were not families; 27.50% of all households were made up of individuals, and 15.50% had someone living alone who was 65 years of age or older. The average household size was 2.48 and the average family size was 3.00.
In the county, the population was distributed as 19.80% under the age of 18, 11.50% from 18 to 24, 30.70% from 25 to 44, 22.90% from 45 to 64, and 15.10% who were 65 years of age or older. The median age was 39 years. For every 100 females, there were 159.30 males. For every 100 females age 18 and over, there were 174.40 males.
The median income for a household in the county was $25,399, and for a family was $31,481. Males had a median income of $23,750 versus $20,221 for females. The per capita income for the county was $14,043. About 15.00% of families and 17.70% of the population were below the poverty line, including 22.90% of those under age 18 and 20.90% of those age 65 or over.
Notable people
From 1921 to 1925, the Democrat Richard M. Chitwood of Sweetwater represented Mitchell County in the state House. He left his post to become the first business manager of Texas Tech University, which he had worked to establish in Sweetwater until the Lubbock site was chosen. He died in 1926 after a year as the business manager.[9]
Politics
| Year | Republican | Democratic | Third parties |
|---|---|---|---|
| 2020 | 84.1% 2,170 | 15.4% 397 | 0.5% 12 |
| 2016 | 81.1% 1,780 | 16.1% 354 | 2.8% 62 |
| 2012 | 75.8% 1,756 | 23.2% 538 | 1.0% 22 |
| 2008 | 74.7% 1,815 | 24.1% 586 | 1.2% 30 |
| 2004 | 74.8% 1,912 | 25.0% 639 | 0.3% 7 |
| 2000 | 66.4% 1,708 | 32.5% 837 | 1.1% 29 |
| 1996 | 39.5% 949 | 50.4% 1,213 | 10.1% 243 |
| 1992 | 36.5% 1,128 | 43.7% 1,353 | 19.8% 612 |
| 1988 | 47.3% 1,596 | 52.5% 1,773 | 0.2% 7 |
| 1984 | 59.8% 2,007 | 39.7% 1,332 | 0.5% 18 |
| 1980 | 49.7% 1,455 | 49.4% 1,446 | 0.9% 25 |
| 1976 | 37.7% 1,058 | 61.7% 1,730 | 0.6% 16 |
| 1972 | 71.8% 1,790 | 28.1% 699 | 0.1% 3 |
| 1968 | 30.0% 893 | 53.3% 1,589 | 16.7% 499 |
| 1964 | 23.3% 737 | 76.6% 2,420 | 0.1% 2 |
| 1960 | 36.1% 1,208 | 63.6% 2,131 | 0.3% 11 |
| 1956 | 36.6% 1,091 | 63.4% 1,891 | |
| 1952 | 41.0% 1,417 | 58.7% 2,031 | 0.4% 12 |
| 1948 | 9.3% 230 | 87.8% 2,181 | 2.9% 73 |
| 1944 | 8.5% 218 | 86.1% 2,215 | 5.4% 140 |
| 1940 | 9.5% 251 | 90.4% 2,401 | 0.2% 5 |
| 1936 | 8.6% 192 | 91.2% 2,035 | 0.2% 4 |
| 1932 | 9.0% 148 | 90.9% 1,490 | 0.1% 2 |
| 1928 | 59.6% 1,099 | 40.4% 746 | |
| 1924 | 11.7% 169 | 85.9% 1,242 | 2.4% 35 |
| 1920 | 10.5% 89 | 81.7% 694 | 7.9% 67 |
| 1916 | 4.2% 39 | 87.0% 803 | 8.8% 81 |
| 1912 | 2.7% 19 | 81.1% 573 | 16.3% 115 |
See also
References
- "State & County QuickFacts". United States Census Bureau. Archived from the original on April 16, 2011. Retrieved December 22, 2013.
- "Find a County". National Association of Counties. Retrieved 2011-06-07.
- "Texas: Individual County Chronologies". Texas Atlas of Historical County Boundaries. The Newberry Library. 2008. Retrieved May 25, 2015.
- "2010 Census Gazetteer Files". United States Census Bureau. August 22, 2012. Retrieved May 4, 2015.
- "Population and Housing Unit Estimates". United States Census Bureau. May 24, 2020. Retrieved May 27, 2020.
- "U.S. Decennial Census". United States Census Bureau. Retrieved May 4, 2015.
- "Texas Almanac: Population History of Counties from 1850–2010" (PDF). Texas Almanac. Retrieved May 4, 2015.
- "U.S. Census website". United States Census Bureau. Retrieved 2011-05-14.
- "Richard M. Chitwood". Texas Legislative Reference Library. Retrieved July 31, 2015.
- Leip, David. "Dave Leip's Atlas of U.S. Presidential Elections". uselectionatlas.org. Retrieved 2018-07-27.
External links
- Mitchell County from the Handbook of Texas Online
- Mitchell County Texas Almanac Page
- Mitchell County Profile from the Texas Association of Counties
Places adjacent to Mitchell County, Texas | ||||||||||
|---|---|---|---|---|---|---|---|---|---|---|
| ||||||||||
Municipalities and communities of Mitchell County, Texas, United States | ||
|---|---|---|
| Cities | Mitchell County map | |
| Town | ||
| CDP | ||
| ||

| Authority control |
|---|