Yoakum County, Texas
Yoakum County is a county located in the far western portion of the U.S. state of Texas. As of the 2010 census, the population was 7,879.[1] Its county seat is Plains.[2] The county was created in 1876 and later organized in 1907.[3] It is named for Henderson King Yoakum, a Texas historian.
Yoakum County | |
|---|---|
 The Yoakum County Courthouse in Plains. | |
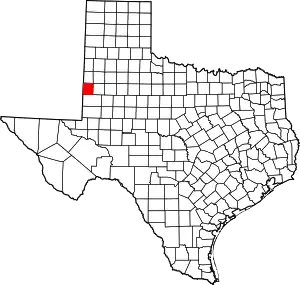 Location within the U.S. state of Texas | |
 Texas's location within the U.S. | |
| Coordinates: 33°11′N 102°49′W | |
| Country | |
| State | |
| Founded | 1907 |
| Seat | Plains |
| Largest town | Denver City |
| Area | |
| • Total | 800 sq mi (2,000 km2) |
| • Land | 800 sq mi (2,000 km2) |
| • Water | 0.01 sq mi (0.03 km2) 0% |
| Population (2010) | |
| • Total | 7,879 |
| • Estimate (2018) | 8,591 |
| • Density | 9.8/sq mi (3.8/km2) |
| Congressional district | 19th |
| Website | www |
Until the passage of a liquor sales referendum held on May 11, 2013, Yoakum had been one of 19 remaining prohibition or entirely dry counties within the state of Texas.[4] Voters in Denver City also approved a separate referendum to permit liquor sales within that community.[5]
In 1965, Recorded Texas Historic Landmark number 5927 was placed at the county courthouse, acknowledging the creation of the county in 1876.[6]
Until after 1900, the county contained primarily nomadic buffalo hunters and a few scattered ranchers. Yoakum County was organized in 1907, and the population increased to 602 because of the sale of state land deeds.[7]
History
Native Americans
Early tribes included Suma-Jumano, Comanche, Cheyenne, and Kiowa.[8]
County established
The Texas Legislature established Yoakum County from Bexar County in 1876. The county was organized in 1907, and Plains became the county seat. In 1900, the area had only 26 residents. One ranch in the county that year was devoted to cattle, rather than crops.[9]
Sale of state land after 1900 brought an increase in population. By 1910, 107 farms or ranches were in the area, and the population had increased to 602.[8]
By 1920, 109 ranches or farms in the area, but the population had fallen to 504. More than 21,000 cattle were reported that year, but crop cultivation remained limited; about 2,200 acres (8.9 km2) were planted in corn, 600 in sorghum, and 47 in cotton. During the 1920s, the county experienced a minor expansion of crop farming, and cotton became the most important crop; by 1930, over 10,000 acres (40 km2) were devoted to cotton. There were 239 farms, and the population had increased to 1,263.[8]
The first oil well in the county gushed in 1935. Denver City benefited with a resulting boom economy. By January 1, 1991, almost 1,664,036,000 barrels (264,560,600 m3) of oil had been taken from county lands since 1936.[10]
Irrigation in the county led to more acres being planted on sorghum, cotton, alfalfa, watermelons, and castor beans. In 1982, 93% of the land in Yoakum County was in farms and ranches, and 44% of the farmland was under cultivation. Some 110,000 acres (450 km2) were irrigated. About 95% of agricultural revenue was derived from crops, especially cotton, sorghum, wheat, hay, and corn.[8]
Geography
According to the U.S. Census Bureau, the county has a total area of 800 square miles (2,100 km2), virtually all of which is land.[11]
Major highways
 U.S. Highway 82
 U.S. Highway 380
 State Highway 83
 State Highway 214
Adjacent counties
- Cochran County (north)
- Terry County (east)
- Gaines County (south)
- Lea County, New Mexico (west/Mountain Time Zone)
Demographics
| Historical population | |||
|---|---|---|---|
| Census | Pop. | %± | |
| 1890 | 4 | — | |
| 1900 | 26 | 550.0% | |
| 1910 | 602 | 2,215.4% | |
| 1920 | 504 | −16.3% | |
| 1930 | 1,263 | 150.6% | |
| 1940 | 5,354 | 323.9% | |
| 1950 | 4,339 | −19.0% | |
| 1960 | 8,032 | 85.1% | |
| 1970 | 7,344 | −8.6% | |
| 1980 | 8,299 | 13.0% | |
| 1990 | 8,786 | 5.9% | |
| 2000 | 7,322 | −16.7% | |
| 2010 | 7,879 | 7.6% | |
| 2019 (est.) | 8,713 | [12] | 10.6% |
| U.S. Decennial Census[13] 1850–2010[14] 2010–2014[1] | |||
As of the census[15] of 2000, 7,322 people, 2,469 households, and 2,007 families resided in the county. The population density was 9 people per square mile (4/km2). The 2,974 housing units averaged 4 per square mile (1/km2). The racial makeup of the county was 70.62% White, 1.39% African American, 0.71% Native American, 0.12% Asian, 0.01% Pacific Islander, 25.48% from other races, and 1.65% from two or more races. About 45.93% of the population was Hispanic or Latino of any race.
Of the 2,469 households, 43.40% had children under the age of 18 living with them, 68.80% were married couples living together, 8.50% had a female householder with no husband present, and 18.70% were not families. About 17.30% of all households were made up of individuals, and 8.50% had someone living alone who was 65 years of age or older. The average household size was 2.95 and the average family size was 3.34.
In the county, the population was distributed as 32.10% under the age of 18, 8.30% from 18 to 24, 26.80% from 25 to 44, 21.30% from 45 to 64, and 11.50% who were 65 years of age or older. The median age was 34 years. For every 100 females there were 94.50 males. For every 100 females age 18 and over, there were 91.40 males.
The median income for a household in the county was $32,672, and for a family was $36,772. Males had a median income of $32,188 versus $19,913 for females. The per capita income for the county was $14,504. About 17.60% of families and 19.60% of the population were below the poverty line, including 24.00% of those under age 18 and 13.00% of those age 65 or over.
Communities
Towns
- Denver City (small part in Gaines County)
- Plains (county seat)
Unincorporated community
Politics
| Year | Republican | Democratic | Third parties |
|---|---|---|---|
| 2016 | 78.0% 1,797 | 18.5% 426 | 3.5% 80 |
| 2012 | 79.8% 1,698 | 19.2% 409 | 1.0% 21 |
| 2008 | 80.9% 1,989 | 18.3% 450 | 0.8% 19 |
| 2004 | 85.3% 2,228 | 14.4% 376 | 0.3% 9 |
| 2000 | 77.5% 1,911 | 21.5% 531 | 0.9% 23 |
| 1996 | 60.5% 1,485 | 30.1% 738 | 9.4% 231 |
| 1992 | 57.7% 1,486 | 23.1% 595 | 19.2% 494 |
| 1988 | 70.3% 1,762 | 29.0% 727 | 0.7% 18 |
| 1984 | 82.6% 2,204 | 17.1% 456 | 0.3% 8 |
| 1980 | 71.9% 1,937 | 26.5% 715 | 1.6% 42 |
| 1976 | 55.1% 1,477 | 44.1% 1,181 | 0.8% 22 |
| 1972 | 79.9% 1,952 | 18.7% 457 | 1.4% 34 |
| 1968 | 45.6% 1,123 | 25.0% 615 | 29.4% 724 |
| 1964 | 37.7% 859 | 62.1% 1,415 | 0.3% 6 |
| 1960 | 54.5% 1,207 | 44.9% 994 | 0.6% 14 |
| 1956 | 48.2% 923 | 51.6% 989 | 0.2% 3 |
| 1952 | 49.5% 858 | 50.4% 873 | 0.1% 2 |
| 1948 | 11.7% 119 | 84.4% 861 | 3.9% 40 |
| 1944 | 12.6% 106 | 77.0% 646 | 10.4% 87 |
| 1940 | 13.2% 134 | 86.9% 885 | |
| 1936 | 5.3% 13 | 92.7% 227 | 2.0% 5 |
| 1932 | 4.3% 11 | 95.3% 245 | 0.4% 1 |
| 1928 | 56.6% 86 | 43.4% 66 | |
| 1924 | 8.0% 9 | 84.8% 95 | 7.1% 8 |
| 1920 | 0.0% 0 | 97.5% 79 | 2.5% 2 |
| 1916 | 1.2% 1 | 97.7% 85 | 1.2% 1 |
| 1912 | 0.0% 0 | 81.6% 40 | 18.4% 9 |
References
- "State & County QuickFacts". United States Census Bureau. Retrieved December 29, 2013.
- "Find a County". National Association of Counties. Retrieved 2011-06-07.
- "Texas: Individual County Chronologies". Texas Atlas of Historical County Boundaries. The Newberry Library. 2008. Retrieved May 27, 2015.
- "TABC Home Page". www.tabc.state.tx.us. Retrieved 2018-08-03.
- "Voters approve sales of alcohol in three elections". Lubbock Avalanche-Journal, May 12, 2013. Retrieved May 13, 2013.
- "Yoakum County - Plains, Yoakum County, Texas". Recorded Texas Historic Landmark. William Nienke, Sam Morrow. Archived from the original on 7 July 2011. Retrieved 19 February 2011.
- Yoakum County Texas Historical Marker
- Leffler, John (2010-06-15). "Yoakum County, Texas". Handbook of Texas Online. Texas State Historical Association. Retrieved 13 December 2010.
- Bennett, Leoti A (2010-06-15). "Plains, Texas". Handbook of Texas Online. Texas State Historical Association. Retrieved 13 December 2010.
- Smith, Julie Cauble (2010-06-15). "Wasson Field". Handbook of Texas Online. Texas State Historical Association. Retrieved 13 December 2010.
- "2010 Census Gazetteer Files". United States Census Bureau. August 22, 2012. Retrieved May 12, 2015.
- "Population and Housing Unit Estimates". United States Census Bureau. May 24, 2020. Retrieved May 27, 2020.
- "U.S. Decennial Census". United States Census Bureau. Retrieved May 12, 2015.
- "Texas Almanac: Population History of Counties from 1850–2010" (PDF). Texas Almanac. Retrieved May 12, 2015.
- "U.S. Census website". United States Census Bureau. Retrieved 2011-05-14.
- Leip, David. "Dave Leip's Atlas of U.S. Presidential Elections". uselectionatlas.org. Retrieved 2018-08-03.
External links
- Youkum County government’s website
- Yoakum County from the Handbook of Texas Online
- TxGenWeb Yoakum County Memories
- Yoakum County Profile from the Texas Association of Counties
Places adjacent to Yoakum County, Texas | ||||||||||
|---|---|---|---|---|---|---|---|---|---|---|
| ||||||||||
Municipalities and communities of Yoakum County, Texas, United States | ||
|---|---|---|
| Towns | Yoakum County map | |
| Unincorporated community | ||
| Footnotes | ‡This populated place also has portions in an adjacent county or counties | |
| ||
