Willacy County, Texas
Willacy County is a county located in the U.S. state of Texas. As of the 2010 census, its population was 22,134.[1] Its county seat is Raymondville.[2] The county was created in 1911 and organized the next year.[3]
Willacy County | |
|---|---|
County | |
| Willacy County | |
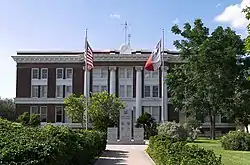 The Willacy County Courthouse in Raymondville | |
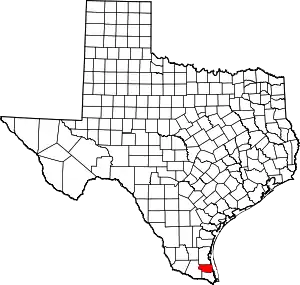 Location within the U.S. state of Texas | |
 Texas's location within the U.S. | |
| Coordinates: 26°29′N 97°36′W | |
| Country | |
| State | |
| Founded | 1912 |
| Named for | John G. Willacy |
| Seat | Raymondville |
| Largest city | Raymondville |
| Area | |
| • Total | 784 sq mi (2,030 km2) |
| • Land | 591 sq mi (1,530 km2) |
| • Water | 194 sq mi (500 km2) 25%% |
| Population (2010) | |
| • Total | 22,134 |
| • Density | 37/sq mi (14/km2) |
| Time zone | UTC−6 (Central) |
| • Summer (DST) | UTC−5 (CDT) |
| Congressional district | 34th |
| Website | www |
Willacy County comprises the Raymondville, TX Micropolitan Statistical Area, which is included in the Brownsville–Harlingen–Raymondville, TX Combined Statistical Area, which itself is part of the larger Rio Grande Valley region.
History
Willacy County was formed in 1911 from parts of Cameron and Hidalgo counties and originally included what is now Kenedy County; it was named for state senator John G. Willacy. Kenedy was split from Willacy in 1921, when the long-settled ranchers of the northern (Kenedy) part of the county sought to separate from the newly arrived farmers of the southern part.
The Bermuda onion was introduced to Willacy County in 1912. It grew well and slowly displaced ranchland in the southern part of the county, becoming the most important crop. For many years the town of Raymondville held an annual Onion Festival, using the tag line, "The Breath of a Nation." In 1940, the first oil wells were sunk in the county's Willamar Oil Field; today oil production is a major part of the local economy, although increasingly eclipsed by natural gas. Also in the 1940s, sorghum was introduced to the county, gradually displacing cotton and other crops. Cattle ranching remains a substantial economic activity as well.
In the early 2010s, wind turbines began to be built in the rural part of the county east of U.S. Highway 77, a number expanded later in 2020. The turbines became an icon to the county's identity, with the turbines being visible from northern Cameron County and eastern Hidalgo County . Power line infrastructure was also improved in this period.
Geography
According to the U.S. Census Bureau, the county has a total area of 784 square miles (2,030 km2), of which 591 square miles (1,530 km2) is land and 194 square miles (500 km2) (25%) is water.[4] It borders the Gulf of Mexico.
Major highways
.svg.png.webp) Interstate 69E (Under Construction)
Interstate 69E (Under Construction) U.S. Highway 77
 State Highway 186
 Farm to Market Road 498
Adjacent counties
- Kenedy County (north)
- Cameron County (south)
- Hidalgo County (west)
National protected areas
Demographics
| Historical population | |||
|---|---|---|---|
| Census | Pop. | %± | |
| 1930 | 10,499 | — | |
| 1940 | 13,230 | 26.0% | |
| 1950 | 20,920 | 58.1% | |
| 1960 | 20,084 | −4.0% | |
| 1970 | 15,570 | −22.5% | |
| 1980 | 17,495 | 12.4% | |
| 1990 | 17,705 | 1.2% | |
| 2000 | 20,082 | 13.4% | |
| 2010 | 22,134 | 10.2% | |
| 2019 (est.) | 21,358 | [5] | −3.5% |
| U.S. Decennial Census[6] 1850–2010[7] 2010–2014[1] | |||
As of the 2010 United States Census, there were 22,134 people living in the county. 54.4% of residents were men. This population lived in 7,040 housing units. The population resides in 5,764 households and 4,607 families. Of all households, 46.0% had children under the age of 18 living with them, 54.5% were married couples living together, 19.3% had a female householder with no husband present, 6.1% had a male householder without a present wife, and non-families comprised 20.1% of households. 32.9% of all households contained an individual who was 65 years of age or older. The average household size was 3.28 and the average family size was 3.73.
Of the population, 85.8% of residents were White (10.1% non-Hispanic white), 2.1% Black or African American, 0.6% Asian, 0.3% Native American, 9.3% of some other race and 1.8% of two or more races. 87.2% of residents were Hispanic or Latino (of any race).
In the county, the population was spread out, with 26.8% under the age of 18, 12.3% from 18 to 24, 27.8% from 25 to 44, 21.4% from 45 to 64, and 11.7% who were 65 years of age or older. The median age was 32 years.
The median income for a household in the county was $22,881, and the median income for a family was $25,399. The per capita income for the county was $10,800. 39.4% of families and 43.4% of the population were below the poverty line, including 50.5% of those under age 18 and 38.3% of those age 65 or over. The county's per-capita income makes it among the poorest counties in the United States.[8]
Education
School districts that serve Willacy County include:
- Lasara Independent School District (K-8)
- Lyford Consolidated Independent School District
- Raymondville Independent School District
- San Perlita Independent School District
In addition, residents are allowed to apply for magnet schools operated by the South Texas Independent School District.
Media
- Raymondville Chronicle & Willacy County News - Official Site
- KFRQ 94.5FM - Official Site
- KKPS 99.5FM - Official Site
- KNVO 101.1FM - Official Site
- KVLY 107.9FM - Official Site
Prisons
Raymondville is the location of three private prisons, all adjacent to each other:[9]
- the Willacy County Correctional Center (closed 2015)
- the Willacy County Regional Detention Center
- and Willacy County State Jail
Recent controversy
The elected officials of the tiny county, recently, have been entangled in a series of political controversies. Amongst other things, the District Attorney has sought the removal of the local sheriff, county clerk, and district clerk. Meanwhile, the Sheriff and the two clerks have petitioned the district court for the removal of the District Attorney. More recently, the District Attorney has gained even more attention for his actions concerning the dismissal of a Capital Murder charge against a confessed assailant because of, he claimed, an appropriate time to prepare. However, he found time to file, the very next day, a petition for the removal of the County Judge.
On November 18, 2008 a Willacy County grand jury indicted a number of political figures, including Vice President Dick Cheney and former Attorney General Alberto Gonzales.
Indictments have not yet been made public and a district judge still has to sign the indictments. Two state district judges were also indicted along with State Senator Eddie Lucio, Jr.[10]
Politics
Like most majority-Hispanic counties in the Rio Grande Valley, Willacy is a staunchly Democratic county. The last Republican to win the county was Richard Nixon in 1972.
| Year | Republican | Democratic | Third parties |
|---|---|---|---|
| 2020 | 43.7% 2,437 | 55.6% 3,097 | 0.7% 41 |
| 2016 | 30.4% 1,547 | 67.2% 3,422 | 2.5% 126 |
| 2012 | 28.0% 1,416 | 71.1% 3,600 | 1.0% 48 |
| 2008 | 29.7% 1,456 | 69.5% 3,409 | 0.8% 38 |
| 2004 | 44.5% 2,209 | 55.1% 2,734 | 0.4% 19 |
| 2000 | 35.3% 1,789 | 63.6% 3,218 | 1.1% 55 |
| 1996 | 24.6% 1,332 | 70.0% 3,789 | 5.4% 290 |
| 1992 | 27.0% 1,490 | 61.0% 3,359 | 12.0% 661 |
| 1988 | 35.4% 1,750 | 64.1% 3,165 | 0.5% 25 |
| 1984 | 43.4% 2,340 | 56.3% 3,037 | 0.3% 14 |
| 1980 | 39.1% 1,995 | 59.7% 3,047 | 1.3% 66 |
| 1976 | 33.8% 1,542 | 65.5% 2,984 | 0.7% 31 |
| 1972 | 62.1% 2,317 | 37.1% 1,384 | 0.8% 29 |
| 1968 | 34.2% 1,243 | 53.1% 1,930 | 12.8% 465 |
| 1964 | 36.3% 1,230 | 63.5% 2,152 | 0.2% 6 |
| 1960 | 39.2% 1,367 | 60.5% 2,109 | 0.3% 11 |
| 1956 | 56.2% 1,656 | 42.8% 1,261 | 1.1% 31 |
| 1952 | 62.8% 2,244 | 37.1% 1,324 | 0.2% 6 |
| 1948 | 35.1% 676 | 59.2% 1,139 | 5.7% 109 |
| 1944 | 43.4% 754 | 48.7% 846 | 7.9% 137 |
| 1940 | 38.5% 740 | 61.1% 1,173 | 0.4% 7 |
| 1936 | 26.9% 376 | 71.6% 1,002 | 1.5% 21 |
| 1932 | 19.9% 259 | 80.0% 1,042 | 0.1% 1 |
| 1928 | 49.6% 389 | 50.5% 396 | |
| 1924 | 25.4% 110 | 70.7% 307 | 3.9% 17 |
| 1920 | 14.5% 9 | 85.5% 53 | |
| 1916 | 8.3% 10 | 91.7% 110 | |
| 1912 | 4.7% 5 | 95.3% 102 |
Communities
Cities
- Lyford
- Raymondville (county seat)
- San Perlita
Census-designated places
Unincorporated community
See also
References
- "State & County QuickFacts". United States Census Bureau. Retrieved December 29, 2013.
- "Find a County". National Association of Counties. Retrieved 2011-06-07.
- "Texas: Individual County Chronologies". Texas Atlas of Historical County Boundaries. The Newberry Library. 2008. Retrieved May 27, 2015.
- "2010 Census Gazetteer Files". United States Census Bureau. August 22, 2012. Retrieved May 12, 2015.
- "Population and Housing Unit Estimates". United States Census Bureau. May 24, 2020. Retrieved May 27, 2020.
- "U.S. Decennial Census". United States Census Bureau. Retrieved May 12, 2015.
- "Texas Almanac: Population History of Counties from 1850–2010" (PDF). Texas Almanac. Retrieved May 12, 2015.
- United States counties by per capita income
- Tyx, Daniel Blue (26 March 2015). "Goodbye to Tent City". Texas Observer. Retrieved 30 July 2016.
- Sherman, Christopher. :State senator wants broad indictments dismissed," The Houston Chronicle. Nov 19, 2008.
- Leip, David. "Dave Leip's Atlas of U.S. Presidential Elections". uselectionatlas.org. Retrieved 2018-08-02.
External links
- Willacy County from the Handbook of Texas Online.
- Historic Willacy County materials, hosted by the Portal to Texas History.
- Willacy County Profile from the Texas Association of Counties
Places adjacent to Willacy County, Texas | ||||||||||
|---|---|---|---|---|---|---|---|---|---|---|
| ||||||||||
Municipalities and communities of Willacy County, Texas, United States | ||
|---|---|---|
| Cities | Willacy County map | |
| CDPs | ||
| Former CDPs | ||
| ||

| Authority control |
|---|