Matagorda County, Texas
Matagorda County is a county located in the U.S. state of Texas. As of the 2010 census, the population was 36,702.[1] Its county seat is Bay City,[2] not to be confused with the larger Baytown in Harris and Chambers Counties. Matagorda County is named for the canebrakes that once grew along the coast (matagorda is a Spanish word meaning "thick bush").
Matagorda County | |
|---|---|
 The Matagorda County Courthouse and Confederate Soldier Statue in Bay City | |
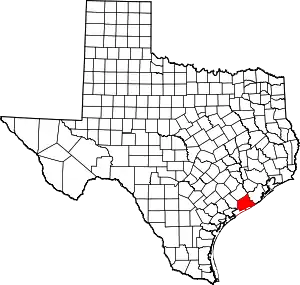 Location within the U.S. state of Texas | |
 Texas's location within the U.S. | |
| Coordinates: 28°47′N 96°00′W | |
| Country | |
| State | |
| Founded | 1836 |
| Seat | Bay City |
| Largest city | Bay City |
| Area | |
| • Total | 1,613 sq mi (4,180 km2) |
| • Land | 1,100 sq mi (3,000 km2) |
| • Water | 512 sq mi (1,330 km2) 32%% |
| Population (2010) | |
| • Total | 36,702 |
| • Density | 33/sq mi (13/km2) |
| Time zone | UTC−6 (Central) |
| • Summer (DST) | UTC−5 (CDT) |
| Congressional district | 27th |
| Website | www |

Matagorda County comprises the Bay City, TX Micropolitan Statistical Area, which is also included in the Houston-The Woodlands, TX combined statistical area.
Geography
According to the U.S. Census Bureau, the county has a total area of 1,613 square miles (4,180 km2), of which 1,100 square miles (2,800 km2) are land and 512 square miles (1,330 km2) (32%) are covered by water.[3] The water area includes Matagorda Bay. It borders the Gulf of Mexico.
Major highways
Adjacent counties
- Brazoria County (northeast)
- Calhoun County (southwest)
- Jackson County (west)
- Wharton County (northwest)
National protected areas
Demographics
| Historical population | |||
|---|---|---|---|
| Census | Pop. | %± | |
| 1850 | 2,124 | — | |
| 1860 | 3,454 | 62.6% | |
| 1870 | 3,377 | −2.2% | |
| 1880 | 3,940 | 16.7% | |
| 1890 | 3,985 | 1.1% | |
| 1900 | 6,097 | 53.0% | |
| 1910 | 13,597 | 123.0% | |
| 1920 | 16,589 | 22.0% | |
| 1930 | 17,678 | 6.6% | |
| 1940 | 20,066 | 13.5% | |
| 1950 | 21,559 | 7.4% | |
| 1960 | 25,744 | 19.4% | |
| 1970 | 27,913 | 8.4% | |
| 1980 | 37,828 | 35.5% | |
| 1990 | 36,928 | −2.4% | |
| 2000 | 37,957 | 2.8% | |
| 2010 | 36,702 | −3.3% | |
| 2019 (est.) | 36,643 | [4] | −0.2% |
| U.S. Decennial Census[5] 1850–2010[6] 2010–2014[1] | |||
As of the census[7] of 2000, 37,957 people, 13,901 households, and 9,925 families were residing in the county. The population density was 34 people per square mile (13/km2). The 18,611 housing units averaged 17 per mi2 (6/km2). The racial makeup of the county was 67.83% White, 12.72% African American, 0.67% Native American, 2.38% Asian, 14.02% from other races, and 2.38% from two or more races. About 31.35% of the population were Hispanic or Latino of any race. By ancestry, 10.3% were of German, 8.2% American, 5.4% English, and 5.2% Irish according to Census 2000, and 73.9% spoke English, 24.0% Spanish, and 1.6% Vietnamese as their first language.
Of the 13,901 households, 36.70% had children under the age of 18 living with them, 53.80% were married couples living together, 12.70% had a female householder with no husband present, and 28.60% were not families. About 25.10% of all households were made up of individuals, and 10.40% had someone living alone who was 65 years of age or older. The average household size was 2.70, and the average family size was 3.25.
In the county, the age distribution was 30.00% under the age of 18, 8.90% from 18 to 24, 26.90% from 25 to 44, 21.80% from 45 to 64, and 12.40% who were 65 years of age or older. The median age was 35 years. For every 100 females, there were 98.60 males. For every 100 females age 18 and over, there were 95.50 males.
The median income for a household in the county was $32,174, and for a family was $40,586. Males had a median income of $37,733 versus $21,871 for females. The per capita income for the county was $15,709. About 14.90% of families and 18.50% of the population were below the poverty line, including 23.00% of those under age 18 and 13.60% of those age 65 or over.
Economy

Rice is grown extensively in Matagorda County, as are St. Augustine and other turf grasses. In addition to a wealth of offshore oil rigs and natural gas extraction facilities all over the county, two petrochemical processing plants (Celanese and Equistar) and the South Texas Project nuclear power plant operate within the county. Matagorda County has secluded, extensive forests, wetlands, prairie, and coastal regions. The Gulf Coast floodplain has several conditions conducive to a variety of ecosystems and recreational activities evident by the highest count of migrating birds in the United States. Fishing (on- and offshore), hunting, and scuba diving are large parts of the recreation industry due to the Colorado River, the forests and Matagorda Bay. The Rio Colorado Golf Course and a birdwatching park are on the Colorado River near the State Highway 35 bridge, and a significant number of wildlife preserves are located around the county, a portion of which is land bought for that purpose by the two major petrochemical refineries and nuclear plant in the county.
Education
School districts serving Matagorda County include:
Notable people
Gallery
 Monument erected by the Daughters of the Confederacy on the Matagorda County Courthouse square in Bay City in 1913
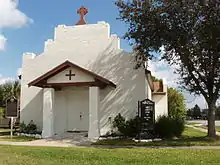 Episcopal Church, Palacios
Politics
| Year | Republican | Democratic | Third parties |
|---|---|---|---|
| 2020 | 71.7% 9,845 | 27.2% 3,733 | 1.1% 149 |
| 2016 | 68.6% 8,366 | 28.7% 3,500 | 2.7% 330 |
| 2012 | 66.3% 8,040 | 32.8% 3,980 | 0.9% 113 |
| 2008 | 63.3% 7,835 | 35.9% 4,440 | 0.8% 98 |
| 2004 | 64.8% 8,119 | 34.8% 4,355 | 0.4% 47 |
| 2000 | 60.9% 7,584 | 37.7% 4,696 | 1.4% 179 |
| 1996 | 47.0% 5,876 | 43.0% 5,374 | 10.0% 1,244 |
| 1992 | 40.5% 5,328 | 36.2% 4,759 | 23.4% 3,078 |
| 1988 | 54.0% 6,787 | 45.2% 5,675 | 0.8% 104 |
| 1984 | 61.7% 8,452 | 38.0% 5,201 | 0.3% 41 |
| 1980 | 53.4% 5,545 | 44.2% 4,585 | 2.4% 252 |
| 1976 | 42.1% 3,679 | 56.9% 4,971 | 0.9% 81 |
| 1972 | 66.8% 5,003 | 33.0% 2,473 | 0.3% 19 |
| 1968 | 36.6% 3,094 | 42.5% 3,595 | 21.0% 1,777 |
| 1964 | 36.7% 2,407 | 63.2% 4,143 | 0.1% 5 |
| 1960 | 49.6% 2,975 | 49.5% 2,971 | 0.9% 52 |
| 1956 | 66.5% 3,927 | 32.2% 1,904 | 1.3% 78 |
| 1952 | 66.2% 4,122 | 33.8% 2,101 | 0.0% 1 |
| 1948 | 30.8% 1,016 | 49.4% 1,628 | 19.9% 655 |
| 1944 | 13.4% 412 | 60.5% 1,854 | 26.1% 801 |
| 1940 | 23.1% 651 | 76.6% 2,156 | 0.2% 6 |
| 1936 | 21.2% 459 | 78.6% 1,700 | 0.2% 5 |
| 1932 | 16.6% 408 | 82.9% 2,039 | 0.6% 14 |
| 1928 | 58.9% 1,194 | 40.9% 829 | 0.3% 6 |
| 1924 | 37.6% 893 | 57.0% 1,353 | 5.4% 128 |
| 1920 | 43.9% 918 | 47.4% 992 | 8.7% 181 |
| 1916 | 23.1% 252 | 68.6% 748 | 8.3% 91 |
| 1912 | 9.6% 107 | 64.0% 710 | 26.4% 293 |
See also
References
- "State & County QuickFacts". United States Census Bureau. Archived from the original on August 13, 2011. Retrieved December 21, 2013.
- "Find a County". National Association of Counties. Retrieved 2011-06-07.
- "2010 Census Gazetteer Files". United States Census Bureau. August 22, 2012. Retrieved May 4, 2015.
- "Population and Housing Unit Estimates". United States Census Bureau. May 24, 2020. Retrieved May 27, 2020.
- "U.S. Decennial Census". United States Census Bureau. Retrieved May 4, 2015.
- "Texas Almanac: Population History of Counties from 1850–2010" (PDF). Texas Almanac. Retrieved May 4, 2015.
- "U.S. Census website". United States Census Bureau. Retrieved 2011-05-14.
- JENKINS, RACHEL (15 June 2010). "HAWLEY, TX". tshaonline.org. Retrieved 22 March 2018.
- Leip, David. "Dave Leip's Atlas of U.S. Presidential Elections". uselectionatlas.org.
External links
![]() Media related to Matagorda County, Texas at Wikimedia Commons
Media related to Matagorda County, Texas at Wikimedia Commons
- Official website
- Matagorda County from the Handbook of Texas Online
- "Matagorda County Profile" from the Texas Association of Counties
Places adjacent to Matagorda County, Texas | ||||||||||
|---|---|---|---|---|---|---|---|---|---|---|
| ||||||||||
| Counties | 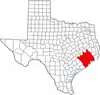 | |
|---|---|---|
| "Principal" cities | ||
| Other cities |
For a complete listing, see list of cities and towns in Houston–The Woodlands–Sugar Land MSA | |
| Unincorporated areas | ||
| Bodies of water | ||
Municipalities and communities of Matagorda County, Texas, United States | ||
|---|---|---|
| Cities | Matagorda County map | |
| CDPs | ||
| Other unincorporated communities | ||
| ||

| Authority control |
|---|