Atascosa County, Texas
Atascosa County (/ˌætəsˈkoʊsə/ AT-əs-KOH-sə) is a county located in the U.S. state of Texas. As of the 2010 United States Census, the population was 44,911.[2] Its county seat is Jourdanton.[3] The county was formed in 1856 from Bexar County and is named for the Atascosa River.
Atascosa County | |
|---|---|
County | |
| Atascosa County | |
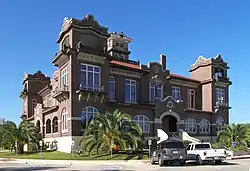 The Atascosa County Courthouse in Jourdanton | |
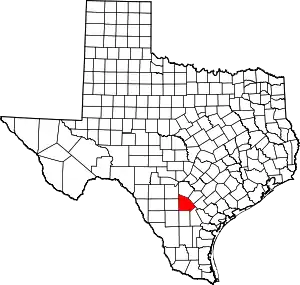 Location within the U.S. state of Texas | |
 Texas's location within the U.S. | |
| Coordinates: 28°53′N 98°32′W | |
| Country | |
| State | |
| Founded | 1856 |
| Named for | Atascosa River |
| Seat | Jourdanton |
| Largest city | Pleasanton |
| Area | |
| • Total | 1,221 sq mi (3,160 km2) |
| • Land | 1,210 sq mi (3,100 km2) |
| • Water | 1.9 sq mi (5 km2) 0.2%% |
| Population (2017) | |
| • Total | 48,981 (est.)[1] |
| • Density | 40.5/sq mi (15.6/km2) |
| Time zone | UTC−6 (Central) |
| • Summer (DST) | UTC−5 (CDT) |
| Congressional district | 28th |
| Website | atascosacounty |
Atascosa County is part of the San Antonio-New Braunfels, TX Metropolitan Statistical Area.
Geography
According to the United States Census Bureau, the county has a total area of 1,221 square miles (3,160 km2), of which 1,220 square miles (3,200 km2) is land and 1.9 square miles (4.9 km2) (0.2%) is water.[4]
The county contains rolling hills and knolls, sloped to the southeast. It is drained by the Atascosa River which exits the county at its SE corner.[5] The highest point is a localized hill near the northeast border with Bexar County, between Lytle and Somerset in Bexar, at 810 feet (247m) ASL.[6]
Major highways
.svg.png.webp) Interstate 35
Interstate 35.svg.png.webp) Interstate 37
Interstate 37 U.S. Highway 281
 Alt. US 281
 State Highway 16
 State Highway 85
 State Highway 97
Adjacent counties
- Bexar County - north
- Wilson County - northeast
- Karnes County - east
- Live Oak County - southeast
- McMullen County - south
- La Salle County - southwest
- Frio County - west
- Medina County - northwest
Demographics
| Historical population | |||
|---|---|---|---|
| Census | Pop. | %± | |
| 1860 | 1,578 | — | |
| 1870 | 2,915 | 84.7% | |
| 1880 | 4,217 | 44.7% | |
| 1890 | 6,459 | 53.2% | |
| 1900 | 7,143 | 10.6% | |
| 1910 | 10,004 | 40.1% | |
| 1920 | 12,702 | 27.0% | |
| 1930 | 15,654 | 23.2% | |
| 1940 | 19,275 | 23.1% | |
| 1950 | 20,048 | 4.0% | |
| 1960 | 18,828 | −6.1% | |
| 1970 | 18,696 | −0.7% | |
| 1980 | 25,055 | 34.0% | |
| 1990 | 30,533 | 21.9% | |
| 2000 | 38,628 | 26.5% | |
| 2010 | 44,911 | 16.3% | |
| 2019 (est.) | 51,153 | [7] | 13.9% |
| US Decennial Census[8] 1850–2010[9] 2010–2014[2] | |||
As of the 2010 United States Census, there were 44,911 people in the county. 84.9% were White, 0.8% Black or African American, 0.8% Native American, 0.3% Asian, 0.1% Pacific Islander, 10.9% of some other race and 2.3% of two or more races. 61.9% were Hispanic or Latino (of any race).
As of the 2000 United States Census,[10] there were 38,628 people, 12,816 households, and 10,022 families in the county. The population density was 31/sqmi (12/km2). There were 14,883 housing units at an average density of 12/sqmi (5/km2). The racial makeup of the county was 73.23% White, 0.60% Black or African American, 0.80% Native American, 0.31% Asian, 0.06% Pacific Islander, 21.53% from other races, and 3.47% from two or more races. 58.56% of the population were Hispanic or Latino of any race.
There were 12,816 households, out of which 41.70% had children under the age of 18 living with them, 60.30% were married couples living together, 13.00% had a female householder with no husband present, and 21.80% were non-families. 18.90% of all households were made up of individuals, and 8.70% had someone living alone who was 65 years of age or older. The average household size was 2.99 and the average family size was 3.41.
The county population contained 31.70% under the age of 18, 8.90% from 18 to 24, 27.60% from 25 to 44, 21.00% from 45 to 64, and 10.80% who were 65 years of age or older. The median age was 32 years. For every 100 females, there were 96.60 males. For every 100 females age 18 and over, there were 94.20 males.
The median income for a household in the county was $33,081, and the median income for a family was $37,705. Males had a median income of $27,702 versus $18,810 for females. The per capita income for the county was $14,276. About 16.10% of families and 20.20% of the population were below the poverty line, including 25.60% of those under age 18 and 21.70% of those age 65 or over.
Education
The following school districts serve Atascosa County:
- Charlotte Independent School District (partial)
- Jourdanton Independent School District
- Karnes City Independent School District (partial)
- Lytle Independent School District (partial)
- Pleasanton Independent School District
- Poteet Independent School District
- Somerset Independent School District (partial)
Communities
Cities
- Charlotte
- Jourdanton (county seat)
- Lytle (partly in Medina and Bexar counties)
- Pleasanton
- Poteet
Town
Census-designated place
Gallery
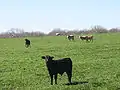 Atascosa County has long been cattle country
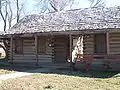 Replica of the original Atascosa County log courthouse in Jourdanton
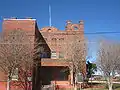 The old Atascosa County Jail in Jourdanton was used from 1911 to 1982
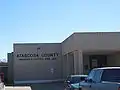 The Atascosa County Sheriff's Office and Jail in Jourdanton is located behind the old log courthouse
 Sign at Trinity Baptist Church in Lytle
Politics
| Year | Republican | Democratic | Third parties |
|---|---|---|---|
| 2016 | 63.0% 8,618 | 34.0% 4,651 | 3.0% 404 |
| 2012 | 58.7% 7,461 | 40.4% 5,133 | 1.0% 127 |
| 2008 | 55.0% 5,462 | 44.4% 4,415 | 0.6% 61 |
| 2004 | 63.0% 7,635 | 36.5% 4,421 | 0.5% 60 |
| 2000 | 58.0% 6,231 | 40.2% 4,322 | 1.8% 193 |
| 1996 | 44.3% 4,102 | 46.0% 4,259 | 9.7% 893 |
| 1992 | 39.4% 3,806 | 39.0% 3,766 | 21.6% 2,086 |
| 1988 | 50.3% 4,777 | 49.0% 4,657 | 0.7% 70 |
| 1984 | 59.7% 5,279 | 40.1% 3,547 | 0.2% 19 |
| 1980 | 51.5% 4,364 | 47.0% 3,980 | 1.5% 125 |
| 1976 | 34.2% 2,415 | 64.6% 4,565 | 1.3% 92 |
| 1972 | 65.3% 3,400 | 34.6% 1,804 | 0.1% 4 |
| 1968 | 35.4% 1,805 | 49.5% 2,522 | 15.1% 771 |
| 1964 | 28.4% 1,283 | 71.4% 3,224 | 0.2% 9 |
| 1960 | 41.6% 1,812 | 58.3% 2,544 | 0.1% 5 |
| 1956 | 54.6% 1,804 | 45.1% 1,492 | 0.3% 11 |
| 1952 | 50.2% 2,147 | 49.6% 2,124 | 0.2% 10 |
| 1948 | 25.8% 704 | 69.4% 1,895 | 4.9% 133 |
| 1944 | 25.9% 685 | 66.4% 1,757 | 7.7% 204 |
| 1940 | 17.8% 418 | 82.0% 1,922 | 0.2% 4 |
| 1936 | 12.1% 285 | 86.9% 2,041 | 1.0% 24 |
| 1932 | 8.3% 192 | 91.1% 2,101 | 0.6% 14 |
| 1928 | 56.6% 888 | 43.4% 682 | |
| 1924 | 21.8% 303 | 62.6% 869 | 15.6% 217 |
| 1920 | 24.1% 185 | 69.2% 531 | 6.7% 51 |
| 1916 | 14.7% 119 | 78.4% 635 | 6.9% 56 |
| 1912 | 4.9% 34 | 85.8% 593 | 9.3% 64 |
See also
References
- "Population and Housing Unit Estimates". Retrieved June 9, 2017.
- "State & County QuickFacts". US Census Bureau. Archived from the original on January 31, 2016. Retrieved December 8, 2013.
- "Find a County". National Association of Counties. Archived from the original on 31 May 2011. Retrieved 7 June 2011.
- "2010 Census Gazetteer Files". US Census Bureau. August 22, 2012. Retrieved April 18, 2015.
- Atascosa County TX (Google Maps - accessed 10 November 2019)
- Highest Point in Atascosa County (peakbagger.com - accessed 10 November 2019)
- "Population and Housing Unit Estimates". United States Census Bureau. May 24, 2020. Retrieved May 27, 2020.
- "US Decennial Census". US Census Bureau. Retrieved April 18, 2015.
- "Texas Almanac: Population History of Counties from 1850–2010" (PDF). Texas Almanac. Retrieved April 18, 2015.
- "U.S. Census website". US Census Bureau. Retrieved 14 May 2011.
- Leip, David. "Atlas of US Presidential Elections". uselectionatlas.org. Retrieved 19 July 2018.
External links
| Wikimedia Commons has media related to Atascosa County, Texas. |
- Atascosa County Government
- Atascosa County, Texas from the Handbook of Texas Online
- Atascosa County from the Texas Almanac
- Atascosa County from the TXGenWeb Project
- "Atascosa County Profile" from the Texas Association of Counties
Places adjacent to Atascosa County, Texas | ||||||||||
|---|---|---|---|---|---|---|---|---|---|---|
| ||||||||||
Municipalities and communities of Atascosa County, Texas, United States | ||
|---|---|---|
| Cities | Atascosa County map | |
| Town | ||
| CDP | ||
| Other unincorporated communities | ||
| Footnotes | ‡This populated place also has portions in an adjacent county or counties | |
| ||

| Authority control |
|---|