Haskell County, Texas
Haskell County is a county located in the U.S. state of Texas. As of the 2010 census, its population was 5,899.[1] The county seat is Haskell.[2] The county was created in 1858 and later organized in 1885.[3] It is named for Charles Ready Haskell, who was killed in the Goliad massacre.
Haskell County | |
|---|---|
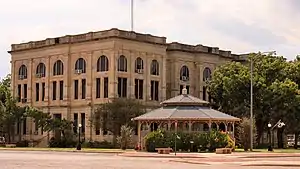 The Haskell County Courthouse | |
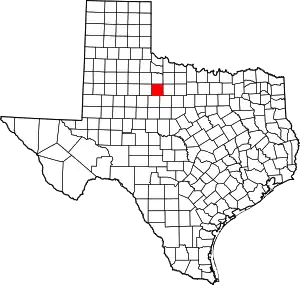 Location within the U.S. state of Texas | |
 Texas's location within the U.S. | |
| Coordinates: 33°11′N 99°44′W | |
| Country | |
| State | |
| Founded | 1885 |
| Named for | Charles Ready Haskell |
| Seat | Haskell |
| Largest city | Haskell |
| Area | |
| • Total | 910 sq mi (2,400 km2) |
| • Land | 903 sq mi (2,340 km2) |
| • Water | 7.1 sq mi (18 km2) 0.8%% |
| Population (2010) | |
| • Total | 5,899 |
| • Density | 6.5/sq mi (2.5/km2) |
| Time zone | UTC−6 (Central) |
| • Summer (DST) | UTC−5 (CDT) |
| Congressional district | 19th |
| Website | www |
Haskell County is the home county of former Texas Governor Rick Perry. Republican Drew Springer, Jr., a businessman from Muenster in Cooke County, has represented Haskell County in the Texas House of Representatives since January 2013.[4]
Geography
According to the U.S. Census Bureau, the county has a total area of 910 square miles (2,400 km2), of which 903 square miles (2,340 km2) are land and 7.1 square miles (18 km2) (0.8%) are covered by water.[5]
Major highways
 U.S. Highway 277
 U.S. Highway 380
 State Highway 6
 State Highway 222
Adjacent counties
- Knox County (north)
- Throckmorton County (east)
- Shackelford County (southeast)
- Jones County (south)
- Stonewall County (west)
- Baylor County (northeast)
- King County (northwest)
Demographics
| Historical population | |||
|---|---|---|---|
| Census | Pop. | %± | |
| 1880 | 48 | — | |
| 1890 | 1,665 | 3,368.8% | |
| 1900 | 2,637 | 58.4% | |
| 1910 | 16,249 | 516.2% | |
| 1920 | 14,193 | −12.7% | |
| 1930 | 16,669 | 17.4% | |
| 1940 | 14,905 | −10.6% | |
| 1950 | 13,736 | −7.8% | |
| 1960 | 11,174 | −18.7% | |
| 1970 | 8,512 | −23.8% | |
| 1980 | 7,725 | −9.2% | |
| 1990 | 6,820 | −11.7% | |
| 2000 | 6,093 | −10.7% | |
| 2010 | 5,899 | −3.2% | |
| 2019 (est.) | 5,658 | [6] | −4.1% |
| U.S. Decennial Census[7] 1850–2010[8] 2010–2014[1] | |||
As of the census[9] of 2000, 6,093 people, 2,569 households, and 1,775 families resided in the county. The population density was 8 people per square mile (3/km2). The 3,555 housing units averaged 4 per square mile (2/km2). The racial makeup of the county was 82.78% White, 2.79% Black or African American, 0.54% Native American, 0.15% Asian, 0.02% Pacific Islander, 11.67% from other races, and 2.05% from two or more races. About 20% of the population was Hispanic or Latino of any race.
Of the 2,569 households, 27.40% had children under the age of 18 living with them, 57.60% were married couples living together, 8.80% had a female householder with no husband present, and 30.90% were not families. About 29.4% of all households were made up of individuals, and 18.30% had someone living alone who was 65 years of age or older. The average household size was 2.33 and the average family size was 2.86.
In the county, the population distributed as 23.70% under the age of 18, 5.70% from 18 to 24, 22.10% from 25 to 44, 22.90% from 45 to 64, and 25.50% who were 65 years of age or older. The median age was 44 years. For every 100 females, there were 88.90 males. For every 100 females age 18 and over, there were 86.30 males.
The median income for a household in the county was $23,690, and for a family was $29,506. Males had a median income of $23,542 versus $16,418 for females. The per capita income for the county was $14,918. About 16.90% of families and 22.80% of the population were below the poverty line, including 34.00% of those under age 18 and 15.40% of those age 65 or over.
Communities
Cities
- Haskell (county seat)
- O'Brien
- Stamford (small part in Jones County)
- Weinert
Unincorporated communities
- Irby
- Paint Creek
- Sagerton
Ghost town
Politics
| Year | Republican | Democratic | Third parties |
|---|---|---|---|
| 2020 | 83.1% 1,840 | 15.9% 353 | 1.0% 21 |
| 2016 | 79.3% 1,403 | 17.7% 314 | 3.0% 53 |
| 2012 | 70.7% 1,424 | 27.5% 553 | 1.8% 36 |
| 2008 | 65.6% 1,388 | 33.0% 699 | 1.4% 29 |
| 2004 | 63.7% 1,539 | 35.9% 867 | 0.4% 10 |
| 2000 | 50.8% 1,488 | 47.9% 1,401 | 1.3% 38 |
| 1996 | 37.6% 966 | 53.4% 1,374 | 9.0% 232 |
| 1992 | 29.9% 852 | 50.4% 1,438 | 19.7% 563 |
| 1988 | 40.9% 1,193 | 58.8% 1,715 | 0.2% 7 |
| 1984 | 54.0% 1,701 | 45.5% 1,434 | 0.5% 16 |
| 1980 | 42.1% 1,447 | 56.8% 1,951 | 1.1% 38 |
| 1976 | 25.0% 838 | 74.8% 2,512 | 0.3% 9 |
| 1972 | 64.7% 1,744 | 35.3% 950 | |
| 1968 | 22.2% 713 | 58.8% 1,888 | 19.0% 610 |
| 1964 | 15.0% 512 | 84.9% 2,903 | 0.2% 6 |
| 1960 | 23.7% 866 | 76.1% 2,776 | 0.2% 8 |
| 1956 | 29.7% 993 | 70.0% 2,340 | 0.2% 8 |
| 1952 | 34.2% 1,290 | 65.7% 2,481 | 0.2% 6 |
| 1948 | 6.0% 181 | 91.2% 2,735 | 2.8% 83 |
| 1944 | 8.5% 261 | 83.5% 2,573 | 8.1% 249 |
| 1940 | 12.1% 405 | 87.8% 2,941 | 0.1% 4 |
| 1936 | 5.4% 156 | 94.5% 2,713 | 0.1% 3 |
| 1932 | 6.2% 154 | 93.2% 2,330 | 0.6% 16 |
| 1928 | 48.1% 1,430 | 51.5% 1,532 | 0.4% 12 |
| 1924 | 16.4% 428 | 78.7% 2,050 | 4.9% 128 |
| 1920 | 15.5% 254 | 68.9% 1,127 | 15.6% 256 |
| 1916 | 5.7% 95 | 72.0% 1,200 | 22.3% 371 |
| 1912 | 3.1% 45 | 69.5% 1,016 | 27.4% 401 |
References
- "State & County QuickFacts". United States Census Bureau. Archived from the original on October 10, 2011. Retrieved December 17, 2013.
- "Find a County". National Association of Counties. Retrieved 2011-06-07.
- "Texas: Individual County Chronologies". Texas Atlas of Historical County Boundaries. The Newberry Library. 2008. Retrieved May 24, 2015.
- "State Rep. Springer announces district tour July 30". Lubbock Avalanche-Journal, July 16, 2013. Retrieved July 18, 2013.
- "2010 Census Gazetteer Files". United States Census Bureau. August 22, 2012. Retrieved April 28, 2015.
- "Population and Housing Unit Estimates". United States Census Bureau. May 24, 2020. Retrieved May 27, 2020.
- "U.S. Decennial Census". United States Census Bureau. Retrieved April 28, 2015.
- "Texas Almanac: Population History of Counties from 1850–2010" (PDF). Texas Almanac. Retrieved April 28, 2015.
- "U.S. Census website". United States Census Bureau. Retrieved 2011-05-14.
- Leip, David. "Dave Leip's Atlas of U.S. Presidential Elections". uselectionatlas.org.
External links
- Haskell County government's website
- Haskell County from the Handbook of Texas Online
- Haskell County Profile from the Texas Association of Counties
Places adjacent to Haskell County, Texas | ||||||||||
|---|---|---|---|---|---|---|---|---|---|---|
| ||||||||||
Municipalities and communities of Haskell County, Texas, United States | ||
|---|---|---|
| Cities | Haskell County map | |
| Towns | ||
| Unincorporated communities | ||
| Ghost town | ||
| Footnotes | ‡This populated place also has portions in an adjacent county or counties | |
| ||

| Authority control |
|---|