Lavaca County, Texas
Lavaca County (/ləˈvɑːkə/ (![]() listen) lə-VAH-kə) is a county located in the U.S. state of Texas. As of the 2010 census, its population was 19,263.[1] Its county seat is Hallettsville.[2] The county was created in 1846.[3] It is named for the Lavaca River which curves its way South East through Moulton and Hallettsville before reaching the coast at Matagorda Bay.[4]
listen) lə-VAH-kə) is a county located in the U.S. state of Texas. As of the 2010 census, its population was 19,263.[1] Its county seat is Hallettsville.[2] The county was created in 1846.[3] It is named for the Lavaca River which curves its way South East through Moulton and Hallettsville before reaching the coast at Matagorda Bay.[4]
Lavaca County | |
|---|---|
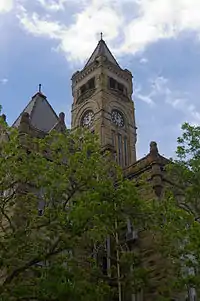 The Lavaca County Courthouse in Hallettsville | |
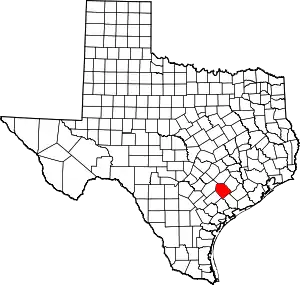 Location within the U.S. state of Texas | |
 Texas's location within the U.S. | |
| Coordinates: 29°23′N 96°56′W | |
| Country | |
| State | |
| Founded | 1846 |
| Named for | Lavaca River |
| Seat | Hallettsville |
| Largest city | Yoakum |
| Area | |
| • Total | 970 sq mi (2,500 km2) |
| • Land | 970 sq mi (2,500 km2) |
| • Water | 0.7 sq mi (2 km2) 0.08%% |
| Population (2010) | |
| • Total | 19,263 |
| • Density | 20/sq mi (8/km2) |
| Time zone | UTC−6 (Central) |
| • Summer (DST) | UTC−5 (CDT) |
| Congressional district | 27th |
| Website | www |
Geography
According to the U.S. Census Bureau, the county has a total area of 970 square miles (2,500 km2), of which 970 square miles (2,500 km2) is land and 0.7 square miles (1.8 km2) (0.08%) is water.[5]
Major highways
Adjacent counties
- Fayette County (north)
- Colorado County (northeast)
- Jackson County (southeast)
- Victoria County (south)
- DeWitt County (southwest)
- Gonzales County (northwest)
Demographics
| Historical population | |||
|---|---|---|---|
| Census | Pop. | %± | |
| 1850 | 1,571 | — | |
| 1860 | 5,945 | 278.4% | |
| 1870 | 9,168 | 54.2% | |
| 1880 | 13,641 | 48.8% | |
| 1890 | 21,887 | 60.5% | |
| 1900 | 28,121 | 28.5% | |
| 1910 | 26,418 | −6.1% | |
| 1920 | 28,964 | 9.6% | |
| 1930 | 27,550 | −4.9% | |
| 1940 | 25,485 | −7.5% | |
| 1950 | 22,159 | −13.1% | |
| 1960 | 20,174 | −9.0% | |
| 1970 | 17,903 | −11.3% | |
| 1980 | 19,004 | 6.1% | |
| 1990 | 18,690 | −1.7% | |
| 2000 | 19,210 | 2.8% | |
| 2010 | 19,263 | 0.3% | |
| 2019 (est.) | 20,154 | [6] | 4.6% |
| U.S. Decennial Census[7] 1850–2010[8] 2010–2014[1] | |||
As of the census[9] of 2000, there were 19,210 people, 7,669 households, and 5,391 families residing in the county. The population density was 20 people per square mile (8/km2). There were 9,657 housing units at an average density of 10 per square mile (4/km2). The racial makeup of the county was 86.86% White, 6.79% Black or African American, 0.19% Native American, 0.16% Asian, 0.02% Pacific Islander, 4.84% from other races, and 1.14% from two or more races. 11.36% of the population were Hispanic or Latino of any race. 27.0% were of Czech, 24.1% German, 9.1% American and 5.1% Irish ancestry according to Census 2000. 86.3% spoke English, 7.7% Spanish, 4.6% Czech and 1.2% German as their first language. In terms of ancestry in 2016, 32.8% were of German, 30.7% were of Czech, 10.8% were of Irish, 5.4% were of English, 3.4% were of American, 2.2% were of French.
There were 7,669 households, out of which 30.00% had children under the age of 18 living with them, 57.70% were married couples living together, 9.30% had a female householder with no husband present, and 29.70% were non-families. 27.60% of all households were made up of individuals, and 16.60% had someone living alone who was 65 years of age or older. The average household size was 2.44 and the average family size was 2.98.
In the county, the population was spread out, with 24.20% under the age of 18, 6.90% from 18 to 24, 23.50% from 25 to 44, 23.60% from 45 to 64, and 21.80% who were 65 years of age or older. The median age was 42 years. For every 100 females there were 93.10 males. For every 100 females age 18 and over, there were 88.50 males.
The median income for a household in the county was $29,132, and the median income for a family was $36,760. Males had a median income of $26,988 versus $17,537 for females. The per capita income for the county was $16,398. About 10.20% of families and 13.20% of the population were below the poverty line, including 15.20% of those under age 18 and 18.40% of those age 65 or over.
Education
The following school public school districts are located in Lavaca County.
Communities
Cities
- Hallettsville (county seat)
- Shiner
- Yoakum (partly in DeWitt County)
Town
Unincorporated communities
Politics
Lavaca County Texas is a very conservative County and has been getting more conservative since 1992. The last Democrat to win the county was Jimmy Carter in 1976.
| Year | Republican | Democratic | Third parties |
|---|---|---|---|
| 2020 | 86.3% 8,804 | 13.1% 1,333 | 0.6% 60 |
| 2016 | 84.8% 7,347 | 13.5% 1,170 | 1.7% 148 |
| 2012 | 81.7% 6,796 | 17.2% 1,428 | 1.1% 90 |
| 2008 | 76.3% 6,293 | 22.7% 1,869 | 1.0% 86 |
| 2004 | 73.1% 5,974 | 26.3% 2,152 | 0.6% 51 |
| 2000 | 70.1% 5,288 | 28.8% 2,171 | 1.2% 87 |
| 1996 | 53.9% 3,697 | 37.6% 2,575 | 8.5% 583 |
| 1992 | 43.2% 3,362 | 34.7% 2,700 | 22.0% 1,714 |
| 1988 | 55.0% 4,377 | 44.4% 3,531 | 0.7% 54 |
| 1984 | 67.2% 5,058 | 32.7% 2,464 | 0.1% 10 |
| 1980 | 54.2% 3,254 | 44.6% 2,678 | 1.1% 67 |
| 1976 | 41.4% 2,466 | 58.0% 3,458 | 0.7% 40 |
| 1972 | 69.7% 3,288 | 30.3% 1,429 | 0.1% 4 |
| 1968 | 32.0% 1,698 | 40.7% 2,165 | 27.3% 1,451 |
| 1964 | 26.8% 1,480 | 73.1% 4,031 | 0.1% 6 |
| 1960 | 27.3% 1,507 | 72.5% 4,002 | 0.2% 13 |
| 1956 | 50.8% 2,509 | 48.8% 2,412 | 0.4% 20 |
| 1952 | 56.6% 3,599 | 43.2% 2,750 | 0.2% 12 |
| 1948 | 25.8% 1,165 | 67.5% 3,046 | 6.7% 300 |
| 1944 | 19.4% 960 | 68.7% 3,406 | 11.9% 589 |
| 1940 | 36.8% 1,412 | 63.1% 2,419 | 0.1% 5 |
| 1936 | 15.4% 403 | 84.1% 2,204 | 0.5% 13 |
| 1932 | 4.9% 224 | 94.9% 4,378 | 0.2% 11 |
| 1928 | 24.3% 911 | 75.7% 2,842 | |
| 1924 | 14.2% 746 | 62.4% 3,290 | 23.4% 1,235 |
| 1920 | 3.1% 100 | 39.1% 1,249 | 57.8% 1,845 |
| 1916 | 31.6% 936 | 60.1% 1,784 | 8.3% 247 |
| 1912 | 12.3% 265 | 67.5% 1,455 | 20.2% 435 |
See also
References
- "State & County QuickFacts". United States Census Bureau. Archived from the original on October 18, 2011. Retrieved December 19, 2013.
- "Find a County". National Association of Counties. Retrieved 2011-06-07.
- "Texas: Individual County Chronologies". Texas Atlas of Historical County Boundaries. The Newberry Library. 2008. Retrieved May 25, 2015.
- Gannett, Henry (1905). The Origin of Certain Place Names in the United States. U.S. Government Printing Office. p. 182.
- "2010 Census Gazetteer Files". United States Census Bureau. August 22, 2012. Retrieved May 3, 2015.
- "Population and Housing Unit Estimates". United States Census Bureau. May 24, 2020. Retrieved May 27, 2020.
- "U.S. Decennial Census". United States Census Bureau. Retrieved May 3, 2015.
- "Texas Almanac: Population History of Counties from 1850–2010" (PDF). Texas Almanac. Retrieved May 3, 2015.
- "U.S. Census website". United States Census Bureau. Retrieved 2011-05-14.
- Leip, David. "Dave Leip's Atlas of U.S. Presidential Elections". uselectionatlas.org. Retrieved 2018-07-26.
External links
- Lavaca County website
- Lavaca County from the Handbook of Texas Online
- https://web.archive.org/web/20101205061757/http://www.tamu.edu/ccbn/dewitt/freelavaca.htm
Places adjacent to Lavaca County, Texas | ||||||||||
|---|---|---|---|---|---|---|---|---|---|---|
| ||||||||||
Municipalities and communities of Lavaca County, Texas, United States | ||
|---|---|---|
| Cities | Lavaca County map | |
| Town | ||
| Unincorporated communities | ||
| Ghost towns | ||
| Footnotes | ‡This populated place also has portions in an adjacent county or counties | |
| ||

| Authority control |
|---|