Floyd County, Texas
Floyd County is a county in the U.S. state of Texas. As of the 2010 census, its population was 6,446.[1] The seat of the county is Floydada.[2] The county was created in 1876 and later organized in 1890.[3] It is named for Dolphin Ward Floyd,[4] who died on his 32nd birthday, March 6, 1836, defending the Alamo.
Floyd County | |
|---|---|
 The Floyd County Courthouse in Floydada | |
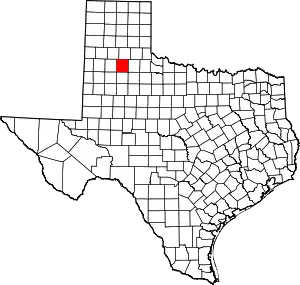 Location within the U.S. state of Texas | |
 Texas's location within the U.S. | |
| Coordinates: 34°04′N 101°18′W | |
| Country | |
| State | |
| Founded | 1890 |
| Named for | Dolphin Ward Floyd |
| Seat | Floydada |
| Largest city | Floydada |
| Area | |
| • Total | 993 sq mi (2,570 km2) |
| • Land | 992 sq mi (2,570 km2) |
| • Water | 0.4 sq mi (1 km2) 0.04%% |
| Population (2010) | |
| • Total | 6,446 |
| • Density | 6.5/sq mi (2.5/km2) |
| Time zone | UTC−6 (Central) |
| • Summer (DST) | UTC−5 (CDT) |
| Congressional districts | 13th, 19th |
| Website | www |
The Matador Ranch, based in Motley County, once reached into Floyd County, as well.[5]
Republican Drew Springer, Jr., a businessman from Muenster in Cooke County, has since January 2013 represented Floyd County in the Texas House of Representatives.[6]
Geography
According to the U.S. Census Bureau, the county has a total area of 993 square miles (2,570 km2), of which 992 square miles (2,570 km2) are land and 0.4 square miles (1.0 km2) (0.04%) is covered by water.[7]
Major highways
 U.S. Highway 62
 U.S. Highway 70
 State Highway 207
Adjacent counties
- Briscoe County (north)
- Motley County (east)
- Crosby County (south)
- Hale County (west)
- Swisher County (northwest)
- Lubbock County (southwest)
- Dickens County (southeast)
Demographics
| Historical population | |||
|---|---|---|---|
| Census | Pop. | %± | |
| 1880 | 3 | — | |
| 1890 | 529 | 17,533.3% | |
| 1900 | 2,020 | 281.9% | |
| 1910 | 4,638 | 129.6% | |
| 1920 | 9,758 | 110.4% | |
| 1930 | 12,409 | 27.2% | |
| 1940 | 10,659 | −14.1% | |
| 1950 | 10,535 | −1.2% | |
| 1960 | 12,369 | 17.4% | |
| 1970 | 11,044 | −10.7% | |
| 1980 | 9,834 | −11.0% | |
| 1990 | 8,497 | −13.6% | |
| 2000 | 7,771 | −8.5% | |
| 2010 | 6,446 | −17.1% | |
| 2019 (est.) | 5,712 | [8] | −11.4% |
| U.S. Decennial Census[9] 1850–2010[10] 2010–2014[1] | |||
As of the census[11] of 2010, the county had 6,446 people.
The 2000 census showed 2,730 households and 2,110 families residing in the county. The population density was 8 people per square mile (3/km2). The3,221 housing units averaged of 3 per square mile (1/km2). The racial makeup of the county was 74.16% White, 3.38% African American, 0.76% Native American, 0.17% Asian, 0.05% Pacific Islander, 19.66% from other races, and 1.81% from two or more races. About 45.93% of the population was Hispanic or Latino of any race.
Of the 2,730 households, 39.40% had children under the age of 18 living with them, 63.90% were married couples living together, 9.70% had a female householder with no husband present, and 22.70% were not families. Around 21.30% of all households were made up of individuals, and 12.30% had someone living alone who was 65 years of age or older. The average household size was 2.79 and the average family size was 3.26.
In the county, the population was distributed as 31.40% under the age of 18, 7.40% from 18 to 24, 24.40% from 25 to 44, 20.70% from 45 to 64, and 16.20% who were 65 years of age or older. The median age was 35 years. For every 100 females there were 93.80 males. For every 100 females age 18 and over, there were 89.90 males.
The median income for a household in the county was $26,851, and for a family was $32,123. Males had a median income of $25,487 versus $18,929 for females. The per capita income for the county was $14,206. About 19.50% of families and 21.50% of the population were below the poverty line, including 28.60% of those under age 18 and 16.50% of those age 65 or over.
Wind energy development
Floyd County is located in what many call the wind corridor of the United States, which stretches from the Panhandle of Texas north into Minnesota, including some of the most wind-rich states in the country, for several reasons. Floyd County is ideal for wind development. Those reasons include the quality of wind in the region, the potential to connect into two different electric grid systems, and the scheduled transmission line build-out in the area.
Politics
| Year | Republican | Democratic | Third parties |
|---|---|---|---|
| 2016 | 75.2% 1,474 | 22.2% 435 | 2.6% 50 |
| 2012 | 73.1% 1,523 | 26.4% 551 | 0.5% 11 |
| 2008 | 70.8% 1,784 | 29.0% 730 | 0.3% 7 |
| 2004 | 78.6% 2,032 | 21.1% 545 | 0.3% 7 |
| 2000 | 75.6% 1,830 | 24.0% 580 | 0.4% 10 |
| 1996 | 57.8% 1,530 | 37.2% 986 | 5.0% 132 |
| 1992 | 55.7% 1,676 | 31.5% 947 | 12.8% 386 |
| 1988 | 55.5% 1,741 | 44.3% 1,391 | 0.2% 6 |
| 1984 | 66.8% 2,092 | 32.6% 1,023 | 0.6% 19 |
| 1980 | 57.5% 2,043 | 41.5% 1,477 | 1.0% 36 |
| 1976 | 41.1% 1,402 | 58.3% 1,991 | 0.6% 21 |
| 1972 | 72.2% 2,181 | 27.8% 841 | |
| 1968 | 40.5% 1,465 | 36.1% 1,305 | 23.4% 847 |
| 1964 | 33.9% 1,229 | 65.8% 2,383 | 0.3% 9 |
| 1960 | 51.9% 1,580 | 47.2% 1,437 | 0.8% 25 |
| 1956 | 44.9% 1,445 | 54.9% 1,767 | 0.3% 9 |
| 1952 | 58.5% 2,066 | 41.4% 1,463 | 0.1% 5 |
| 1948 | 13.0% 344 | 81.9% 2,174 | 5.1% 135 |
| 1944 | 15.1% 370 | 71.7% 1,756 | 13.2% 322 |
| 1940 | 20.4% 484 | 79.3% 1,880 | 0.3% 7 |
| 1936 | 10.4% 217 | 88.9% 1,863 | 0.7% 15 |
| 1932 | 6.8% 145 | 92.9% 1,976 | 0.2% 5 |
| 1928 | 63.8% 1,176 | 36.2% 666 | |
| 1924 | 11.9% 166 | 86.0% 1,197 | 2.1% 29 |
| 1920 | 15.7% 167 | 78.9% 841 | 5.4% 58 |
| 1916 | 6.6% 48 | 81.9% 600 | 11.6% 85 |
| 1912 | 4.8% 22 | 83.0% 381 | 12.2% 56 |
See also
References
- "State & County QuickFacts". United States Census Bureau. Archived from the original on October 18, 2011. Retrieved December 16, 2013.
- "Find a County". National Association of Counties. Archived from the original on 2011-05-31. Retrieved 2011-06-07.
- "Texas: Individual County Chronologies". Texas Atlas of Historical County Boundaries. The Newberry Library. 2008. Retrieved May 23, 2015.
- Gannett, Henry (1905). The Origin of Certain Place Names in the United States. Govt. Print. Off. pp. 127.
- "Matador Ranch," Historical marker, Texas Historical Commission, Motley County, Texas
- "State Rep. Springer announces district tour July 30". Lubbock Avalanche-Journal, July 16, 2013. Retrieved July 18, 2013.
- "2010 Census Gazetteer Files". United States Census Bureau. August 22, 2012. Retrieved April 26, 2015.
- "Population and Housing Unit Estimates". United States Census Bureau. May 24, 2020. Retrieved May 27, 2020.
- "U.S. Decennial Census". United States Census Bureau. Retrieved April 26, 2015.
- "Texas Almanac: Population History of Counties from 1850–2010" (PDF). Texas Almanac. Retrieved April 26, 2015.
- "U.S. Census website". United States Census Bureau. Retrieved 2011-05-14.
- Leip, David. "Dave Leip's Atlas of U.S. Presidential Elections". uselectionatlas.org. Retrieved 2018-07-22.
External links
- Floyd County from the Handbook of Texas Online
- Floyd County Profile from the Texas Association of Counties
Places adjacent to Floyd County, Texas | ||||||||||
|---|---|---|---|---|---|---|---|---|---|---|
| ||||||||||
Municipalities and communities of Floyd County, Texas, United States | ||
|---|---|---|
| City | Floyd County map | |
| Town | ||
| Unincorporated communities | ||
| ||

| Authority control |
|---|