Hyde County, South Dakota
Hyde County is a county in the U.S. state of South Dakota. As of the 2010 census, the population was 1,420,[1] making it the fourth-least populous county in South Dakota. Its county seat is Highmore.[2] The county was founded in 1873, as a county of the Dakota Territory, and organized in 1883.[3] It was named for James Hyde, a member of legislature in the 1870s.[4]
Hyde County | |
|---|---|
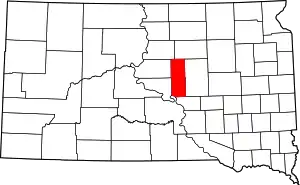 Location within the U.S. state of South Dakota | |
 South Dakota's location within the U.S. | |
| Coordinates: 44°33′N 99°29′W | |
| Country | |
| State | |
| Founded | 1883 |
| Named for | James Hyde |
| Seat | Highmore |
| Largest city | Highmore |
| Area | |
| • Total | 866 sq mi (2,240 km2) |
| • Land | 861 sq mi (2,230 km2) |
| • Water | 5.6 sq mi (15 km2) 0.6% |
| Population (2010) | |
| • Total | 1,420 |
| • Estimate (2018) | 1,282 |
| • Density | 1.6/sq mi (0.63/km2) |
| Time zone | UTC−6 (Central) |
| • Summer (DST) | UTC−5 (CDT) |
| Congressional district | At-large |
| Website | www |
History
Hyde County was created by the territorial legislature on 8 January 1873, with area partitioned from Buffalo County. It was not organized by that action. Its boundaries were altered by changes in October 1879 and February 1883. On 5 November 1883, the county organization was filled and the county was placed in independent operation.[3]
The current Hyde County courthouse was constructed in 1911 (it is currently listed on the National Register of Historic Places). The county organization included a jail until 1974, when the jail was abandoned and jail-related services were contracted to surrounding counties.[5]
Geography
The county terrain consists of semi-arid rolling hills, partly devoted to agriculture. The Missouri River flows southeastward at its SW corner, and delineates a portion of the county's south boundary line.[6]
The terrain slopes toward the county's SW corner. Its highest point is on the lower part of its eastern boundary line, at 2,080' (634m) ASL.[7]
Hyde County has a total area of 866 square miles (2,240 km2), of which 861 square miles (2,230 km2) is land and 5.6 square miles (15 km2) (0.6%) is water.[8]
Major highways
Adjacent counties
- Faulk County - north
- Hand County - east
- Buffalo County - south
- Lyman County - southwest
- Hughes County - southwest
- Sully County - west
- Potter County - northwest
Protected areas[6]
- Chapelle State Game Production Area
- Highmore State Game Production Area
- Rezac Lake State Game Production Area
- Rice Lake State Game Production Area
Lakes[6]
- Baloun Lake
- Chapelle Lake
- Lake Boehm
- Rezac Lake
- Rice Lake
- Thomas Lake
Demographics
| Historical population | |||
|---|---|---|---|
| Census | Pop. | %± | |
| 1890 | 1,860 | — | |
| 1900 | 1,492 | −19.8% | |
| 1910 | 3,307 | 121.6% | |
| 1920 | 3,315 | 0.2% | |
| 1930 | 3,690 | 11.3% | |
| 1940 | 3,113 | −15.6% | |
| 1950 | 2,811 | −9.7% | |
| 1960 | 2,602 | −7.4% | |
| 1970 | 2,515 | −3.3% | |
| 1980 | 2,069 | −17.7% | |
| 1990 | 1,696 | −18.0% | |
| 2000 | 1,671 | −1.5% | |
| 2010 | 1,420 | −15.0% | |
| 2019 (est.) | 1,301 | [9] | −8.4% |
| US Decennial Census[10] 1790-1960[11] 1900-1990[12] 1990-2000[13] 2010-2018[1] | |||
2000 census
As of the 2000 United States Census,[14] there were 1,671 people, 679 households, and 456 families in the county. The population density was 2 people per square mile (1/km2). There were 769 housing units at an average density of 0.9 per square mile (0.3/km2). The racial makeup of the county was 91.08% White, 0.12% Black or African American, 7.96% Native American, 0.12% Pacific Islander, 0.12% from other races, and 0.60% from two or more races. 0.48% of the population were Hispanic or Latino of any race.
There were 679 households, out of which 29.60% had children under the age of 18 living with them, 55.70% were married couples living together, 6.00% had a female householder with no husband present, and 32.80% were non-families. 30.30% of all households were made up of individuals, and 17.10% had someone living alone who was 65 years of age or older. The average household size was 2.41 and the average family size was 3.00.
The county population contained 25.60% under the age of 18, 5.80% from 18 to 24, 23.50% from 25 to 44, 22.70% from 45 to 64, and 22.30% who were 65 years of age or older. The median age was 42 years. For every 100 females there were 102.10 males. For every 100 females age 18 and over, there were 97.00 males.
The median income for a household in the county was $31,103, and the median income for a family was $40,700. Males had a median income of $24,728 versus $18,833 for females. The per capita income for the county was $16,356. About 7.80% of families and 12.30% of the population were below the poverty line, including 13.40% of those under age 18 and 13.70% of those age 65 or over.
2010 census
As of the 2010 United States Census, there were 1,420 people, 600 households, and 385 families in the county.[15] The population density was 1.7 inhabitants per square mile (0.66/km2). There were 708 housing units at an average density of 0.8 per square mile (0.31/km2).[16] The racial makeup of the county was 89.1% white, 8.5% American Indian, 0.2% Asian, 0.1% Pacific islander, 0.1% black or African American, 0.2% from other races, and 1.9% from two or more races. Those of Hispanic or Latino origin made up 1.1% of the population.[15] In terms of ancestry,[17]
Of the 600 households, 26.2% had children under the age of 18 living with them, 53.7% were married couples living together, 5.5% had a female householder with no husband present, 35.8% were non-families, and 33.0% of all households were made up of individuals. The average household size was 2.30 and the average family size was 2.92. The median age was 46.4 years.[15]
The median income for a household in the county was $41,196 and the median income for a family was $61,161. Males had a median income of $36,053 versus $28,456 for females. The per capita income for the county was $22,995. About 8.3% of families and 11.2% of the population were below the poverty line, including 11.6% of those under age 18 and 14.1% of those age 65 or over.[18]
Communities
City
- Highmore (county seat)
Townships
- Banner
- Bramhall
- Douglas
- Eden
- Franklin
- Holabird
- Highmore
- Illinois
- Lincoln
- Loomis
- Spring Lake
- Union
- Valley
- William Hamilton
Unorganized territories
- Central Hyde
- Crow Creek
- North Hyde
Politics
Hyde County voters have been reliably Republican ever since South Dakota's statehood. In only two national elections – the Democratic landslides of Franklin D. Roosevelt in 1932 and Lyndon B. Johnson in 1964 – has the county ever voted for a Democratic presidential candidate – although in the Republican landslides of 1956 (due to a major drought and resultant agricultural problems) and 1972 (due to a strong “favorite son” vote for George McGovern) the county actually voted about 4 points more Democratic than the nation at-large.
| Year | Republican | Democratic | Third parties |
|---|---|---|---|
| 2016 | 78.7% 543 | 18.1% 125 | 3.2% 22 |
| 2012 | 72.4% 531 | 25.8% 189 | 1.8% 13 |
| 2008 | 69.7% 547 | 28.8% 226 | 1.5% 12 |
| 2004 | 70.1% 631 | 28.8% 259 | 1.1% 10 |
| 2000 | 70.9% 592 | 26.1% 218 | 3.0% 25 |
| 1996 | 54.5% 493 | 34.2% 309 | 11.3% 102 |
| 1992 | 46.1% 440 | 31.5% 301 | 22.4% 214 |
| 1988 | 53.6% 546 | 42.8% 436 | 3.6% 37 |
| 1984 | 69.4% 797 | 30.5% 350 | 0.1% 1 |
| 1980 | 70.8% 864 | 22.4% 273 | 6.9% 84 |
| 1976 | 54.4% 687 | 45.3% 572 | 0.3% 4 |
| 1972 | 59.5% 789 | 40.2% 533 | 0.3% 4 |
| 1968 | 53.8% 713 | 37.7% 499 | 8.5% 113 |
| 1964 | 47.5% 666 | 52.5% 736 | |
| 1960 | 53.9% 773 | 46.1% 660 | |
| 1956 | 55.8% 755 | 44.2% 597 | |
| 1952 | 72.8% 1,051 | 27.2% 393 | |
| 1948 | 59.3% 817 | 40.1% 553 | 0.7% 9 |
| 1944 | 65.0% 842 | 35.0% 454 | |
| 1940 | 60.3% 1,018 | 39.7% 670 | |
| 1936 | 52.5% 795 | 45.1% 683 | 2.4% 36 |
| 1932 | 42.5% 678 | 56.1% 895 | 1.4% 23 |
| 1928 | 60.8% 961 | 38.5% 608 | 0.7% 11 |
| 1924 | 50.5% 669 | 19.4% 257 | 30.1% 398 |
| 1920 | 68.5% 710 | 22.5% 233 | 9.0% 93 |
| 1916 | 55.6% 438 | 38.7% 305 | 5.7% 45 |
| 1912 | 33.1% 232 | 66.9% 468 | |
| 1908 | 64.5% 455 | 30.0% 212 | 5.5% 39 |
| 1904 | 76.9% 443 | 15.8% 91 | 7.3% 42 |
| 1900 | 69.8% 286 | 28.1% 115 | 2.2% 9 |
| 1896 | 64.5% 223 | 35.0% 121 | 0.6% 2 |
| 1892 | 56.4% 184 | 15.6% 51 | 27.9% 91 |
References
- "State & County QuickFacts". United States Census Bureau. Archived from the original on June 7, 2011. Retrieved November 25, 2013.
- "Find a County". National Association of Counties. Archived from the original on May 31, 2011. Retrieved June 7, 2011.
- "Dakota Territory, South Dakota, and North Dakota: Individual County Chronologies". Dakota Territory Atlas of Historical County Boundaries. The Newberry Library. 2006. Retrieved March 29, 2015.
- Gannett, Henry (1905). The Origin of Certain Place Names in the United States. Govt. Print. Off. p. 164.
- About Hyde County (accessed 4 February 2019)
- Hyde County SD Google Maps (accessed February 4, 2019)
- ""Find an Altitude" Google Maps (accessed February 4, 2019)". Archived from the original on May 21, 2019. Retrieved February 4, 2019.
- "2010 Census Gazetteer Files". US Census Bureau. August 22, 2012. Retrieved March 26, 2015.
- "Annual Estimates of the Resident Population for Counties: April 1, 2010 to July 1, 2019". Retrieved April 10, 2020.
- "US Decennial Census". US Census Bureau. Retrieved March 26, 2015.
- "Historical Census Browser". University of Virginia Library. Retrieved March 26, 2015.
- Forstall, Richard L., ed. (March 27, 1995). "Population of Counties by Decennial Census: 1900 to 1990". US Census Bureau. Retrieved March 26, 2015.
- "Census 2000 PHC-T-4. Ranking Tables for Counties: 1990 and 2000" (PDF). US Census Bureau. April 2, 2001. Retrieved March 26, 2015.
- "U.S. Census website". US Census Bureau. Retrieved May 14, 2011.
- "Profile of General Population and Housing Characteristics: 2010 Demographic Profile Data". US Census Bureau. Archived from the original on 13 February 2020. Retrieved 12 March 2016.
- "Population, Housing Units, Area, and Density: 2010 - County". US Census Bureau. Archived from the original on 13 February 2020. Retrieved 12 March 2016.
- "Selected Social Characteristics in the US – 2006-2010 American Community Survey 5-Year Estimates". U.S. Census Bureau. Archived from the original on February 13, 2020. Retrieved March 12, 2016.
- "Selected Economic Characteristics — 2006-2010 American Community Survey 5-Year Estimates". U.S. Census Bureau. Archived from the original on February 13, 2020. Retrieved March 12, 2016.
- Leip, David. "Atlas of US Presidential Elections". uselectionatlas.org. Retrieved April 15, 2018.
Places adjacent to Hyde County, South Dakota | ||||||||||
|---|---|---|---|---|---|---|---|---|---|---|
| ||||||||||
Municipalities and communities of Hyde County, South Dakota, United States | ||
|---|---|---|
| City | | |
| Unincorporated communities | ||
| Indian reservation | ||
| Footnotes | ‡This populated place also has portions in an adjacent county or counties | |
| ||
