Day County, South Dakota
Day County is a county in the U.S. state of South Dakota. As of the 2010 census, the population was 5,710.[1] Its county seat is Webster.[2] The county is named for Merritt H. Day, pioneer and 1879 Dakota Territory legislator.[3][4]
Day County | |
|---|---|
 | |
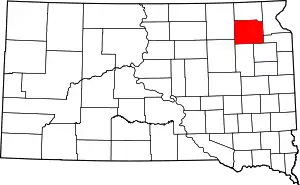 Location within the U.S. state of South Dakota | |
 South Dakota's location within the U.S. | |
| Coordinates: 45°22′N 97°37′W | |
| Country | |
| State | |
| Founded | 1880 |
| Named for | Merritt H. Day |
| Seat | Webster |
| Largest city | Webster |
| Area | |
| • Total | 1,091 sq mi (2,830 km2) |
| • Land | 1,028 sq mi (2,660 km2) |
| • Water | 63 sq mi (160 km2) 5.8% |
| Population (2010) | |
| • Total | 5,710 |
| • Estimate (2018) | 5,505 |
| • Density | 5.2/sq mi (2.0/km2) |
| Time zone | UTC−6 (Central) |
| • Summer (DST) | UTC−5 (CDT) |
| Congressional district | At-large |
| Website | day |
Geography
The terrain of Day County consists of rolling hills, partly devoted to agriculture. It is dotted with numerous lakes and ponds, especially its eastern portion.[5] The terrain slopes to the west; its highest point is the northeast corner, at 2,014' (614m) ASL.[6] The county has a total area of 1,091 square miles (2,830 km2), of which 1,028 square miles (2,660 km2) is land and 63 square miles (160 km2) (5.8%) is water.[7]
Lakes
- Amsden
- Antelope
- Bitter
- Blue Dog
- Enemy Swim
- Horseshoe
- Lynn
- Minnewaste
- Pickerel Lake
- Reetz
- Rush
- Sweetwater
- Waubay
Major highways
 U.S. Highway 12
 South Dakota Highway 25
 South Dakota Highway 27
Adjacent counties
- Marshall County - north
- Roberts County - east
- Grant County - southeast
- Codington County - southeast
- Clark County - south
- Spink County - southwest
- Brown County - west
Protected areas
- Buchner Slough State Public Shooting Area[8]
- Holmquist Slough State Public Shooting Area[9]
- Lily State Public Shooting Area[10]
- Myland Pass State Public Shooting Area[11]
- Nelson Slough State Public Shooting Area[12]
- Pickerel Lake State Recreation Area[13]
- Pierpont Lake Recreation Area[14]
- Waubay National Wildlife Refuge
Demographics
| Historical population | |||
|---|---|---|---|
| Census | Pop. | %± | |
| 1880 | 97 | — | |
| 1890 | 9,168 | 9,351.5% | |
| 1900 | 12,254 | 33.7% | |
| 1910 | 14,372 | 17.3% | |
| 1920 | 15,194 | 5.7% | |
| 1930 | 14,606 | −3.9% | |
| 1940 | 13,565 | −7.1% | |
| 1950 | 12,294 | −9.4% | |
| 1960 | 10,516 | −14.5% | |
| 1970 | 8,713 | −17.1% | |
| 1980 | 8,133 | −6.7% | |
| 1990 | 6,978 | −14.2% | |
| 2000 | 6,267 | −10.2% | |
| 2010 | 5,710 | −8.9% | |
| 2019 (est.) | 5,424 | [15] | −5.0% |
| US Decennial Census[16] 1790-1960[17] 1900-1990[18] 1990-2000[19] 2010-2018[1] | |||
2000 census
As of the 2000 United States Census,[20] there were 6,267 people, 2,586 households, and 1,688 families in the county. The population density was 6 people per square mile (2/km2). There were 3,618 housing units at an average density of 4 per square mile (1/km2). The racial makeup of the county was 91.26% White, 0.13% Black or African American, 7.40% Native American, 0.06% Asian, 0.05% Pacific Islander, 0.16% from other races, and 0.94% from two or more races. 0.38% of the population were Hispanic or Latino of any race. 34.5% were of German, 26.9% Norwegian and 10.9% Polish ancestry.
There were 2,586 households, out of which 27.30% had children under the age of 18 living with them, 54.40% were married couples living together, 6.80% had a female householder with no husband present, and 34.70% were non-families. 31.80% of all households were made up of individuals, and 18.00% had someone living alone who was 65 years of age or older. The average household size was 2.36 and the average family size was 2.98.
The county population contained 25.50% under the age of 18, 5.20% from 18 to 24, 22.40% from 25 to 44, 23.40% from 45 to 64, and 23.50% who were 65 years of age or older. The median age was 43 years. For every 100 females there were 96.50 males. For every 100 females age 18 and over, there were 94.50 males.
The median income for a household in the county was $30,227, and the median income for a family was $38,011. Males had a median income of $27,279 versus $18,179 for females. The per capita income for the county was $15,856. About 11.40% of families and 14.30% of the population were below the poverty line, including 17.40% of those under age 18 and 11.80% of those age 65 or over.
2010 census
As of the 2010 United States Census, there were 5,710 people, 2,504 households, and 1,561 families in the county.[21] The population density was 5.6 inhabitants per square mile (2.2/km2). There were 3,630 housing units at an average density of 3.5 per square mile (1.4/km2).[22] The racial makeup of the county was 88.1% white, 9.5% American Indian, 0.2% Asian, 0.1% black or African American, 0.4% from other races, and 1.7% from two or more races. Those of Hispanic or Latino origin made up 1.1% of the population.[21] In terms of ancestry, 43.8% were German, 25.1% were Norwegian, 12.8% were Polish, 8.8% were Irish, and 6.1% were American.[23]
Of the 2,504 households, 24.4% had children under the age of 18 living with them, 50.0% were married couples living together, 7.9% had a female householder with no husband present, 37.7% were non-families, and 34.0% of all households were made up of individuals. The average household size was 2.22 and the average family size was 2.83. The median age was 47.9 years.[21]
The median income for a household in the county was $36,818 and the median income for a family was $47,949. Males had a median income of $36,549 versus $25,750 for females. The per capita income for the county was $20,542. About 10.7% of families and 12.5% of the population were below the poverty line, including 11.7% of those under age 18 and 14.1% of those age 65 or over.[24]
Communities
Townships
- Andover
- Bristol
- Butler
- Central Point
- Egeland
- Farmington
- Grenville
- Highland
- Homer
- Independence
- Kidder
- Kosciusko
- Liberty
- Lynn
- Morton
- Nutley
- Oak Gulch
- Racine
- Raritan
- Rusk
- Scotland
- Troy
- Union
- Valley
- Waubay
- Webster
- Wheatland
- York
Politics
Day County voters have tended to vote Democratic for the past several decades. Since 1948 the county has selected the Democratic Party candidate in 71% of national elections.
| Year | Republican | Democratic | Third parties |
|---|---|---|---|
| 2016 | 59.2% 1,627 | 35.5% 974 | 5.3% 146 |
| 2012 | 46.0% 1,320 | 52.1% 1,497 | 2.0% 56 |
| 2008 | 42.8% 1,372 | 55.7% 1,785 | 1.5% 48 |
| 2004 | 47.2% 1,671 | 51.3% 1,817 | 1.5% 52 |
| 2000 | 50.8% 1,623 | 46.7% 1,492 | 2.6% 82 |
| 1996 | 36.3% 1,282 | 52.1% 1,840 | 11.6% 411 |
| 1992 | 31.2% 1,161 | 42.4% 1,578 | 26.5% 986 |
| 1988 | 42.8% 1,616 | 56.6% 2,137 | 0.6% 21 |
| 1984 | 52.4% 2,150 | 47.1% 1,932 | 0.5% 19 |
| 1980 | 55.2% 2,507 | 37.9% 1,720 | 7.0% 316 |
| 1976 | 38.0% 1,617 | 61.3% 2,610 | 0.7% 30 |
| 1972 | 42.0% 1,971 | 57.9% 2,719 | 0.2% 9 |
| 1968 | 43.8% 2,062 | 52.3% 2,463 | 3.9% 182 |
| 1964 | 37.2% 1,914 | 62.8% 3,235 | |
| 1960 | 48.1% 2,626 | 51.9% 2,835 | |
| 1956 | 47.2% 2,652 | 52.8% 2,971 | |
| 1952 | 60.8% 3,648 | 39.2% 2,351 | |
| 1948 | 42.9% 2,438 | 55.4% 3,146 | 1.7% 97 |
| 1944 | 51.0% 2,593 | 49.0% 2,487 | |
| 1940 | 49.9% 3,277 | 50.2% 3,297 | |
| 1936 | 36.9% 2,113 | 58.2% 3,335 | 4.9% 281 |
| 1932 | 32.0% 1,983 | 63.2% 3,910 | 4.8% 298 |
| 1928 | 54.2% 3,180 | 45.1% 2,642 | 0.7% 43 |
| 1924 | 55.2% 2,193 | 7.8% 308 | 37.1% 1,474 |
| 1920 | 59.8% 2,739 | 9.5% 436 | 30.7% 1,404 |
| 1916 | 61.2% 1,758 | 31.6% 907 | 7.2% 207 |
| 1912 | 0.0% 0 | 33.8% 787 | 66.2% 1,544 |
| 1908 | 59.2% 1,616 | 29.8% 813 | 11.0% 300 |
| 1904 | 73.5% 2,077 | 13.6% 383 | 13.0% 366 |
| 1900 | 56.4% 1,558 | 39.5% 1,092 | 4.1% 114 |
| 1896 | 48.1% 1,171 | 50.5% 1,230 | 1.4% 35 |
| 1892 | 38.9% 752 | 18.7% 362 | 42.3% 818 |
See also
References
- "State & County QuickFacts". United States Census Bureau. Archived from the original on June 7, 2011. Retrieved November 25, 2013.
- "Find a County". National Association of Counties. Archived from the original on May 31, 2011. Retrieved June 7, 2011.
- <Legislative Manual 2005, p. 596
- Gannett, Henry (1905). The Origin of Certain Place Names in the United States. Govt. Print. Off. p. 101.
- Day County SD Google Maps (accessed 1 February 2019)
- ""Find an Altitude" Google Maps (accessed 1 February 2019)". Archived from the original on 21 May 2019. Retrieved 2 February 2019.
- "2010 Census Gazetteer Files". US Census Bureau. August 22, 2012. Retrieved March 24, 2015.
- Buchner Slough State Public Shooting Area, Webster SD Google Maps (accessed 1 February 2019)
- Holmquist Slough State Public Shooting Area, Webster SD Google Maps (accessed 1 February 2019)
- Lily State Public Shooting Area Google Maps (accessed 1 February 2019)
- Myland Pass State Public Shooting Area, Webster SD Google Maps (accessed 1 February 2019)
- Nelson Slough State Public Shooting Area, Webster SD Google Maps (accessed 1 February 2019)
- Pickerel Lake State Recreation Area Google Maps (accessed 1 February 2019)
- Pierpont Lake Recreation Area, Pierpont SD Google Maps (accessed 1 February 2019)
- "Annual Estimates of the Resident Population for Counties: April 1, 2010 to July 1, 2019". Retrieved April 10, 2020.
- "US Decennial Census". US Census Bureau. Retrieved March 24, 2015.
- "Historical Census Browser". University of Virginia Library. Retrieved March 24, 2015.
- Forstall, Richard L., ed. (March 27, 1995). "Population of Counties by Decennial Census: 1900 to 1990". US Census Bureau. Retrieved March 24, 2015.
- "Census 2000 PHC-T-4. Ranking Tables for Counties: 1990 and 2000" (PDF). US Census Bureau. April 2, 2001. Retrieved March 24, 2015.
- "U.S. Census website". US Census Bureau. Retrieved May 14, 2011.
- "Profile of General Population and Housing Characteristics: 2010 Demographic Profile Data". US Census Bureau. Archived from the original on 13 February 2020. Retrieved 11 March 2016.
- "Population, Housing Units, Area, and Density: 2010 - County". US Census Bureau. Archived from the original on 13 February 2020. Retrieved 11 March 2016.
- "Selected Social Characteristics in the US – 2006-2010 American Community Survey 5-Year Estimates". US Census Bureau. Archived from the original on 13 February 2020. Retrieved 11 May 2016.
- "Selected Economic Characteristics – 2006-2010 American Community Survey 5-Year Estimates". US Census Bureau. Archived from the original on 13 February 2020. Retrieved 11 March 2016.
- Amsden, Groton SD Google Maps (accessed 1 February 2019)
- Enemy Swim Google Maps (accessed 1 February 2019)
- Leip, David. "Atlas of US Presidential Elections". uselectionatlas.org. Retrieved 15 April 2018.
External links
Places adjacent to Day County, South Dakota | ||||||||||
|---|---|---|---|---|---|---|---|---|---|---|
| ||||||||||
Municipalities and communities of Day County, South Dakota, United States | ||
|---|---|---|
| Cities | | |
| Towns | ||
| Unincorporated communities | ||
| Indian reservation | ||
| Footnotes | ‡This populated place also has portions in an adjacent county or counties | |
| ||

| Authority control |
|---|