Lyman County, South Dakota
Lyman County is a county located in the U.S. state of South Dakota. As of the 2010 census, the population was 3,755.[1] Its county seat is Kennebec.[2]
Lyman County | |
|---|---|
 | |
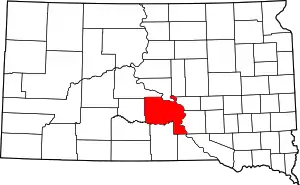 Location within the U.S. state of South Dakota | |
 South Dakota's location within the U.S. | |
| Coordinates: 43°54′N 99°51′W | |
| Country | |
| State | |
| Founded | 1893 |
| Named for | W. P. Lyman |
| Seat | Kennebec |
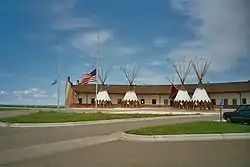
| Largest community | Lower Brule |
| Area | |
| • Total | 1,707 sq mi (4,420 km2) |
| • Land | 1,642 sq mi (4,250 km2) |
| • Water | 65 sq mi (170 km2) 3.8% |
| Population (2010) | |
| • Total | 3,755 |
| • Estimate (2018) | 3,821 |
| • Density | 2.2/sq mi (0.85/km2) |
| Time zone | UTC−6 (Central) |
| • Summer (DST) | UTC−5 (CDT) |
| Congressional district | At-large |
| Website | www |
Lyman County was created by the Dakota Territorial Legislature on January 8, 1873, but was not organized until May 21, 1893. Its boundaries were altered in 1891, 1897, 1898, and 1916.[3] The county was named for W. P. Lyman, a politician.[4]
History
Lyman County was created in 1873 and organized in 1893.[3] Oacoma served as its first county seat in 1891; in 1922 the seat was transferred to Kennebec.[5]
Geography
Lyman County is bordered on the north and east by the Missouri River, which flows southerly along its edge, and the western portion of its south line is also delineated by the White River, which then continued flowing eastward through the county's eastern area to discharge into the Missouri. Its upper central portion is drained by the Bad Horse Creek, which discharges into the Missouri near the midpoint of the county's north boundary.
The county terrain consists of rolling hills, sloping to the river drainages. Its area is largely devoted to agriculture.[6][7] The county has a total area of 1,707 square miles (4,420 km2), of which 1,642 square miles (4,250 km2) is land and 65 square miles (170 km2) (3.8%) is water.[8]
Major highways
 Interstate 90
 U.S. Highway 83
 U.S. Highway 183
 South Dakota Highway 47
 South Dakota Highway 49
 South Dakota Highway 53
 South Dakota Highway 273
 South Dakota Highway 1806
Adjacent counties
- Hughes County - north
- Hyde County - northeast
- Buffalo County - northeast
- Brule County - east
- Charles Mix County - southeast
- Gregory County - south
- Tripp County - south
- Mellette County - southwest
- Jones County - west
- Stanley County - northwest
Protected areas[6]
- Brakke State Game Production Area
- Brye Bottom State Game Production Area
- Bull Creek State Game Production Area
- Carpenter State Game Production Area
- Cedar Creek Recreation Area
- Counselor Creek Recreation Area
- Dude Ranch State Lakeside Use Area
- Fate Dam State Game Production Aea
- Fort Pierre National Grassland (part)
- Good Soldier Creek Recreation Area
- Iona State Game Production Area
- Iron Nation Recreation Area
- Lindely State Game Production Area
- Lower Brule Recreation Area
- Narrows Recreation Area
- Neugebauer State Game Production Area
- Reis Bottom State Game Production Area
- Salzmann State Game Production Area
Lakes
- Lake Francis Case (part)
- Lake Sharpe (part)
Demographics
| Historical population | |||
|---|---|---|---|
| Census | Pop. | %± | |
| 1880 | 124 | — | |
| 1890 | 233 | 87.9% | |
| 1900 | 2,632 | 1,029.6% | |
| 1910 | 10,848 | 312.2% | |
| 1920 | 6,591 | −39.2% | |
| 1930 | 6,335 | −3.9% | |
| 1940 | 5,045 | −20.4% | |
| 1950 | 4,572 | −9.4% | |
| 1960 | 4,428 | −3.1% | |
| 1970 | 4,060 | −8.3% | |
| 1980 | 3,864 | −4.8% | |
| 1990 | 3,638 | −5.8% | |
| 2000 | 3,895 | 7.1% | |
| 2010 | 3,755 | −3.6% | |
| 2019 (est.) | 3,781 | [9] | 0.7% |
| US Decennial Census[10] 1790-1960[11] 1900-1990[12] 1990-2000[13] 2010-2018[1] | |||
2000 census
As of the 2000 United States Census,[14] there were 3,895 people, 1,400 households, and 1,009 families in the county. The population density was 2 people per square mile (1/km2). There were 1,636 housing units at an average density of 1.0 per square mile (0.4/km2). The racial makeup of the county was 64.75% White, 0.08% Black or African American, 33.27% Native American, 0.23% Asian, 0.05% from other races, and 1.62% from two or more races. 0.46% of the population were Hispanic or Latino of any race.
There were 1,400 households, out of which 36.10% had children under the age of 18 living with them, 51.40% were married couples living together, 13.80% had a female householder with no husband present, and 27.90% were non-families. 24.60% of all households were made up of individuals, and 10.50% had someone living alone who was 65 years of age or older. The average household size was 2.77 and the average family size was 3.29.
The county population contained 32.10% under the age of 18, 7.60% from 18 to 24, 25.90% from 25 to 44, 20.90% from 45 to 64, and 13.60% who were 65 years of age or older. The median age was 34 years. For every 100 females there were 104.60 males. For every 100 females age 18 and over, there were 102.10 males.
The median income for a household in the county was $28,509, and the median income for a family was $32,028. Males had a median income of $22,628 versus $18,672 for females. The per capita income for the county was $13,862. About 19.40% of families and 24.30% of the population were below the poverty line, including 24.00% of those under age 18 and 12.90% of those age 65 or over.
2010 census
As of the 2010 United States Census, there were 3,755 people, 1,392 households, and 967 families in the county.[15] The population density was 2.3 inhabitants per square mile (0.89/km2). There were 1,704 housing units at an average density of 1.04 per square mile (0.40/km2).[16] The racial makeup of the county was 58.3% white, 38.2% American Indian, 0.3% Asian, 0.1% black or African American, 0.1% from other races, and 2.9% from two or more races. Those of Hispanic or Latino origin made up 1.1% of the population.[15] In terms of ancestry, 27.3% were German, 9.2% were Irish, 9.1% were Norwegian, and 1.0% were American.[17]
Of the 1,392 households, 35.6% had children under the age of 18 living with them, 47.1% were married couples living together, 15.2% had a female householder with no husband present, 30.5% were non-families, and 27.2% of all households were made up of individuals. The average household size was 2.67 and the average family size was 3.19. The median age was 36.1 years.[15]
The median income for a household in the county was $36,323 and the median income for a family was $45,045. Males had a median income of $32,760 versus $25,512 for females. The per capita income for the county was $16,930. About 17.4% of families and 18.8% of the population were below the poverty line, including 25.4% of those under age 18 and 5.8% of those age 65 or over.[18]
Communities
City
Census-designated places
Townships
- Bailey
- Butte
- Dorman
- Fairland
- Iona
- Morningside
- Oacoma
- Pleasant
- Pratt
- Reliance
- Rex
- Rose
- Rowe
- Sioux
- Stony Butte
- Vivian
Unorganized territories
- Black Dog
- Lafayette
- Lower Brule
- McClure
- Northwest Lyman
- South Lyman
Politics
Lyman County voters have been Republican for decades. In no national election has the county selected a Democratic Party candidate since 1964, although Jimmy Carter, Michael Dukakis, Bill Clinton and Barack Obama have all managed to exceed forty percent. When Hillary Clinton ran on the Democratic ticket in 2016, she won 26 percent of the county's vote, for the lowest Democratic result since Alton B. Parker in 1904 (22 percent).
| Year | Republican | Democratic | Third parties |
|---|---|---|---|
| 2016 | 68.8% 977 | 26.0% 369 | 5.3% 75 |
| 2012 | 59.5% 933 | 38.6% 605 | 2.0% 31 |
| 2008 | 54.5% 894 | 43.3% 710 | 2.3% 37 |
| 2004 | 53.0% 1,029 | 45.0% 872 | 2.0% 39 |
| 2000 | 63.1% 875 | 34.8% 482 | 2.1% 29 |
| 1996 | 47.7% 726 | 42.4% 646 | 9.9% 151 |
| 1992 | 45.2% 669 | 32.8% 486 | 22.0% 325 |
| 1988 | 57.0% 843 | 42.6% 631 | 0.4% 6 |
| 1984 | 69.8% 1,120 | 29.8% 478 | 0.4% 7 |
| 1980 | 66.9% 1,256 | 25.9% 486 | 7.2% 136 |
| 1976 | 51.3% 892 | 47.8% 831 | 0.9% 16 |
| 1972 | 60.0% 1,166 | 39.8% 774 | 0.2% 4 |
| 1968 | 57.9% 1,063 | 35.0% 643 | 7.1% 131 |
| 1964 | 44.9% 862 | 55.1% 1,057 | |
| 1960 | 57.8% 1,166 | 42.2% 852 | |
| 1956 | 56.9% 1,151 | 43.1% 873 | |
| 1952 | 70.1% 1,561 | 29.9% 666 | |
| 1948 | 51.9% 993 | 47.3% 904 | 0.8% 15 |
| 1944 | 57.9% 867 | 42.1% 630 | |
| 1940 | 56.1% 1,409 | 44.0% 1,105 | |
| 1936 | 44.7% 1,090 | 54.1% 1,321 | 1.2% 29 |
| 1932 | 29.7% 811 | 68.8% 1,879 | 1.5% 40 |
| 1928 | 54.8% 1,488 | 45.0% 1,222 | 0.3% 8 |
| 1924 | 44.3% 1,061 | 16.2% 387 | 39.5% 947 |
| 1920 | 59.6% 1,050 | 26.3% 463 | 14.1% 248 |
| 1916 | 45.7% 981 | 49.0% 1,052 | 5.4% 116 |
| 1912 | 39.8% 766 | 60.2% 1,159 | |
| 1908 | 53.1% 1,524 | 41.2% 1,183 | 5.7% 162 |
| 1904 | 73.5% 986 | 22.8% 306 | 3.7% 49 |
| 1900 | 66.6% 429 | 32.6% 210 | 0.8% 5 |
| 1896 | 59.1% 114 | 40.4% 78 | 0.5% 1 |
See also
| Wikimedia Commons has media related to Lyman County, South Dakota. |
References
- "State & County QuickFacts". United States Census Bureau. Archived from the original on June 7, 2011. Retrieved November 25, 2013.
- "Find a County". National Association of Counties. Retrieved June 7, 2011.
- Individual County Chronologies/Lyman County (accessed 5 February 2019)
- Gannett, Henry (1905). The Origin of Certain Place Names in the United States. US Government Printing Office. p. 192.
- Hellmann, Paul T. (May 13, 2013). Historical Gazetteer of the United States. Routledge. p. 994. ISBN 978-1135948597. Retrieved November 30, 2013.
- Lyman County SD Google Maps (accessed 5 February 2019)
- ""Find an Altitude" Google Maps (accessed 5 February 2019)". Archived from the original on May 21, 2019. Retrieved February 6, 2019.
- "2010 Census Gazetteer Files". US Census Bureau. August 22, 2012. Retrieved March 28, 2015.
- "Annual Estimates of the Resident Population for Counties: April 1, 2010 to July 1, 2019". Retrieved April 10, 2020.
- "US Decennial Census". US Census Bureau. Retrieved March 28, 2015.
- "Historical Census Browser". University of Virginia Library. Retrieved March 28, 2015.
- Forstall, Richard L., ed. (March 27, 1995). "Population of Counties by Decennial Census: 1900 to 1990". US Census Bureau. Retrieved March 28, 2015.
- "Census 2000 PHC-T-4. Ranking Tables for Counties: 1990 and 2000" (PDF). US Census Bureau. April 2, 2001. Retrieved March 28, 2015.
- "U.S. Census website". US Census Bureau. Retrieved May 14, 2011.
- "Profile of General Population and Housing Characteristics: 2010 Demographic Profile Data". US Census Bureau. Archived from the original on February 13, 2020. Retrieved March 12, 2016.
- "Population, Housing Units, Area, and Density: 2010 - County". US Census Bureau. Archived from the original on February 13, 2020. Retrieved March 12, 2016.
- "Selected Social Characteristics in the US – 2006-2010 American Community Survey 5-Year Estimates". US Census Bureau. Archived from the original on February 13, 2020. Retrieved March 12, 2016.
- "Selected Economic Characteristics – 2006-2010 American Community Survey 5-Year Estimates". US Census Bureau. Archived from the original on February 13, 2020. Retrieved March 12, 2016.
- Leip, David. "Atlas of US Presidential Elections". uselectionatlas.org. Retrieved April 15, 2018.
External links
Places adjacent to Lyman County, South Dakota | ||||||||||
|---|---|---|---|---|---|---|---|---|---|---|
| ||||||||||
Municipalities and communities of Lyman County, South Dakota, United States | ||
|---|---|---|
| City | | |
| Towns | ||
| CDPs | ||
| Unincorporated communities | ||
| Indian reservations | ||
| Ghost town | ||
| Footnotes | ‡This populated place also has portions in an adjacent county or counties | |
| ||

| Authority control |
|---|