Codington County, South Dakota
Codington County is a county in the U.S. state of South Dakota. As of the 2010 United States Census, the population was 27,227.[1] Its county seat is Watertown.[2] The county was created in 1877 and organized in 1878.[3] It is named for Rev. George S. S. Codington, Dakota Territory legislator.[4]
Codington County | |
|---|---|
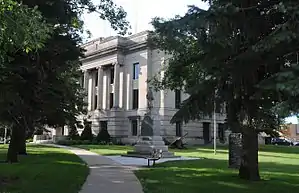 Codington County Courthouse in July 2013 | |
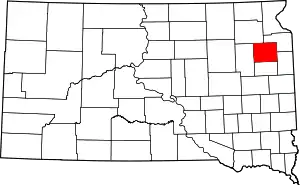 Location within the U.S. state of South Dakota | |
 South Dakota's location within the U.S. | |
| Coordinates: 44°59′N 97°11′W | |
| Country | |
| State | |
| Founded | 1877 (created) 1878 (organized) |
| Named for | Reverend George S. S. Codington |
| Seat | Watertown |
| Largest city | Watertown |
| Area | |
| • Total | 717 sq mi (1,860 km2) |
| • Land | 688 sq mi (1,780 km2) |
| • Water | 29 sq mi (80 km2) 4.0% |
| Population (2010) | |
| • Total | 27,227 |
| • Estimate (2018) | 28,015 |
| • Density | 38/sq mi (15/km2) |
| Time zone | UTC−6 (Central) |
| • Summer (DST) | UTC−5 (CDT) |
| Congressional district | At-large |
| Website | www |
Codington County comprises the Watertown, SD Micropolitan Statistical Area.
Geography
Codington County terrain consists of rolling hills dotted with lakes and ponds, especially in the southwest portion. The land is largely devoted to agriculture.[5] The terrain is higher on the county's east and west sides, and generally slopes to the south.[6] The county has a total area of 717 square miles (1,860 km2), of which 688 square miles (1,780 km2) is land and 29 square miles (75 km2) (4.0%) is water.[7]
Major highways
 Interstate 29
 U.S. Highway 81
 U.S. Highway 212
 South Dakota Highway 20
- South Dakota Highway 20P
Adjacent counties
- Grant County - northeast
- Deuel County - southeast
- Hamlin County - south
- Clark County - west
- Day County - northwest
Protected areas
- American Game Association State Public Shooting Area[8]
- Blythe State Public Shooting Area[9]
- Christopherson State Public Shooting Area[10]
- Clarksean State Public Shooting Area[11]
- Codington County State Public Shooting Area[12]
- Curley State Public Shooting Area[13]
- Elmore State Public Shooting Area[14]
- Gilbert State Public Shooting Area[15]
- Goose Lake State Public Shooting Area[16]
- Hanson State Public Shooting Area[17]
- Horseshoe Lake State Public Shooting Area[18]
- Larson State Public Shooting Area[19]
- McKillicans Lake State Public Shooting Area[20]
- North Nichols State Public Shooting Area[21]
- North Stink Lake State Public Shooting Area[22]
- Pelican Lake State Recreation Area[23]
- Punished Womans Lake State Shooting Area[24]
- Sandy Shore State Recreation Area[25]
- Spencer State Public Shooting Area[26]
- Spoonbill Pass State Public Shooting Area[27]
- Thompson's Point State Lakeside Use Area[28]
- Warner Lake State Public Shooting Area[29]
- Wolf State Public Shooting Area (partial)[30]
Major lakes[5]
- Cottonwood Lake
- Dry Lake
- Goose Lake
- Grass Lake
- Horseshoe Lake
- Kings Lake
- Lake Kampeska
- Lake Nicholson
- Long Lake
- McKillicans Lake
- Medicine Lake
- Pelican Lake
- Punished Womans Lake
- Round Lake
- Still Lake
- Warner Lake
Demographics
| Historical population | |||
|---|---|---|---|
| Census | Pop. | %± | |
| 1880 | 2,156 | — | |
| 1890 | 7,037 | 226.4% | |
| 1900 | 8,770 | 24.6% | |
| 1910 | 14,092 | 60.7% | |
| 1920 | 16,549 | 17.4% | |
| 1930 | 17,457 | 5.5% | |
| 1940 | 17,014 | −2.5% | |
| 1950 | 18,944 | 11.3% | |
| 1960 | 20,220 | 6.7% | |
| 1970 | 19,140 | −5.3% | |
| 1980 | 20,885 | 9.1% | |
| 1990 | 22,698 | 8.7% | |
| 2000 | 25,897 | 14.1% | |
| 2010 | 27,227 | 5.1% | |
| 2019 (est.) | 28,009 | [31] | 2.9% |
| US Decennial Census[32] 1790-1960[33] 1900-1990[34] 1990-2000[35] 2010-2018[1] | |||
2000 census
As of the 2000 United States Census,[36] there were 25,897 people, 10,357 households, and 6,877 families in the county. The population density was 38 people per square mile (15/km2). There were 11,324 housing units at an average density of 16 per square mile (6/km2). The racial makeup of the county was 96.74% White, 0.14% Black or African American, 1.41% Native American, 0.28% Asian, 0.02% Pacific Islander, 0.57% from other races, and 0.84% from two or more races. 1.06% of the population were Hispanic or Latino of any race. 48.2% were of German, 20.0% Norwegian and 5.5% Irish ancestry, 96.7% spoke English, 1.5% Spanish and 1.2% German as their first language.
There were 10,357 households, out of which 33.60% had children under the age of 18 living with them, 54.50% were married couples living together, 8.10% had a female householder with no husband present, and 33.60% were non-families. 27.90% of all households were made up of individuals, and 10.80% had someone living alone who was 65 years of age or older. The average household size was 2.46 and the average family size was 3.04.
The county population contained 26.80% under the age of 18, 10.40% from 18 to 24, 28.00% from 25 to 44, 20.70% from 45 to 64, and 14.10% who were 65 years of age or older. The median age was 35 years. For every 100 females, there were 98.50 males. For every 100 females age 18 and over, there were 96.50 males.
The median income for a household in the county was $36,257, and the median income for a family was $45,153. Males had a median income of $30,279 versus $19,826 for females. The per capita income for the county was $18,761. About 5.60% of families and 9.00% of the population were below the poverty line, including 8.60% of those under age 18 and 10.80% of those age 65 or over.
2010 census
As of the 2010 United States Census, there were 27,227 people, 11,432 households, and 7,216 families in the county.[37] The population density was 39.5 inhabitants per square mile (15.3/km2). There were 12,397 housing units at an average density of 18.0 per square mile (6.9/km2).[38] The racial makeup of the county was 95.3% white, 2.0% American Indian, 0.4% Asian, 0.3% black or African American, 0.6% from other races, and 1.3% from two or more races. Those of Hispanic or Latino origin made up 1.6% of the population.[37] In terms of ancestry, 54.3% were German, 22.6% were Norwegian, 9.6% were Irish, 6.7% were English, and 3.3% were American.[39]
Of the 11,432 households, 30.7% had children under the age of 18 living with them, 49.9% were married couples living together, 9.0% had a female householder with no husband present, 36.9% were non-families, and 30.6% of all households were made up of individuals. The average household size was 2.35 and the average family size was 2.93. The median age was 37.7 years.[37]
The median income for a household in the county was $43,275 and the median income for a family was $60,202. Males had a median income of $39,076 versus $26,945 for females. The per capita income for the county was $24,781. About 8.9% of families and 12.7% of the population were below the poverty line, including 13.7% of those under age 18 and 16.8% of those age 65 or over.[40]
Communities
City
- Watertown (county seat)
Towns
Census-designated place
Townships
- Dexter
- Eden
- Elmira
- Fuller
- Germantown
- Graceland
- Henry
- Kampeska
- Kranzburg
- Lake
- Leola
- Pelican
- Phipps
- Rauville
- Richland
- Sheridan
- Waverly
Politics
Codington County voters have been reliably Republican for several decades. In no national election since 1976 has the county selected the Democratic Party candidate.
| Year | Republican | Democratic | Third parties |
|---|---|---|---|
| 2016 | 66.5% 7,764 | 27.2% 3,174 | 6.3% 731 |
| 2012 | 58.1% 6,696 | 39.8% 4,588 | 2.1% 240 |
| 2008 | 52.3% 6,374 | 45.9% 5,595 | 1.8% 216 |
| 2004 | 61.0% 7,778 | 37.7% 4,803 | 1.3% 170 |
| 2000 | 60.3% 6,718 | 37.6% 4,192 | 2.1% 228 |
| 1996 | 45.2% 4,995 | 42.7% 4,722 | 12.1% 1,338 |
| 1992 | 36.0% 3,943 | 33.8% 3,701 | 30.2% 3,299 |
| 1988 | 52.0% 5,050 | 47.1% 4,570 | 1.0% 94 |
| 1984 | 63.1% 6,108 | 36.5% 3,528 | 0.4% 42 |
| 1980 | 59.1% 5,903 | 33.6% 3,353 | 7.4% 734 |
| 1976 | 48.9% 4,504 | 50.8% 4,680 | 0.3% 29 |
| 1972 | 51.6% 4,936 | 48.1% 4,601 | 0.3% 27 |
| 1968 | 46.5% 3,929 | 50.1% 4,235 | 3.4% 288 |
| 1964 | 40.2% 3,593 | 59.8% 5,353 | |
| 1960 | 55.2% 5,309 | 44.8% 4,304 | |
| 1956 | 57.7% 5,150 | 42.3% 3,772 | |
| 1952 | 65.9% 5,750 | 34.1% 2,974 | |
| 1948 | 45.0% 3,349 | 54.3% 4,042 | 0.7% 50 |
| 1944 | 51.8% 3,348 | 48.2% 3,120 | |
| 1940 | 53.8% 4,320 | 46.2% 3,705 | |
| 1936 | 39.4% 3,005 | 55.9% 4,256 | 4.7% 359 |
| 1932 | 34.3% 2,538 | 65.0% 4,806 | 0.7% 52 |
| 1928 | 53.1% 3,762 | 46.6% 3,299 | 0.4% 26 |
| 1924 | 41.4% 1,862 | 13.9% 627 | 44.7% 2,011 |
| 1920 | 59.8% 2,706 | 19.2% 867 | 21.0% 949 |
| 1916 | 51.8% 1,550 | 44.9% 1,344 | 3.2% 97 |
| 1912 | 0.0% 0 | 45.0% 1,111 | 55.0% 1,356 |
| 1908 | 63.3% 1,618 | 32.5% 831 | 4.2% 107 |
| 1904 | 72.2% 1,741 | 24.1% 582 | 3.7% 89 |
| 1900 | 58.3% 1,225 | 38.3% 805 | 3.4% 72 |
| 1896 | 57.1% 1,041 | 41.6% 759 | 1.3% 23 |
| 1892 | 52.2% 882 | 24.1% 408 | 23.7% 401 |
See also
| Wikimedia Commons has media related to Codington County, South Dakota. |
References
- "State & County QuickFacts". United States Census Bureau. Archived from the original on July 8, 2011. Retrieved November 26, 2013.
- "Find a County". National Association of Counties. Archived from the original on 31 May 2011. Retrieved June 7, 2011.
- "Dakota Territory, South Dakota, and North Dakota: Individual County Chronologies". Dakota Territory Atlas of Historical County Boundaries. The Newberry Library. 2006. Retrieved March 29, 2015.
- Gannett, Henry (1905). The Origin of Certain Place Names in the United States. Govt. Print. Off. p. 86.
- Codington County SD Google Maps (accessed 1 February 2019)
- ""Find an Altitude" Google Maps (accessed 1 February 2019)". Archived from the original on 21 May 2019. Retrieved 1 February 2019.
- "2010 Census Gazetteer Files". US Census Bureau. August 22, 2012. Retrieved March 23, 2015.
- American Game Association State Public Shooting Area, Florence SD Google Maps (accessed 1 February 2019)
- Blythe State Public Shooting Area, Henry SD Google Maps (accessed 1 February 2019)
- Christopherson State Public Shooting Area, Henry SD Google Maps (accessed 1 February 2019)
- Clarksean State Public Shooting Area, Henry SD Google Maps (accessed 1 February 2019)
- Codington County State Public Shooting Area Google Maps (accessed 1 February 2019)
- Curley State Public Shooting Area Google Maps (accessed 1 February 2019)
- Elmore State Public Shooting Area Google Maps (accessed 1 February 2019)
- Gilbert State Public Shooting Area, Henry SD Google Maps (accessed 1 February 2019)
- Goose Lake State Public Shooting Area, Watertown SD Google Maps (accessed 1 February 2019)
- Hanson State Public Shooting Area Google Maps (accessed 1 February 2019)
- Horseshoe Lake State Public Shooting Area, Florence SD Google Maps (accessed 1 February 2019)
- Larson State Public Shooting Area, South Shore SD Google Maps (accessed 1 February 2019)
- McKillicans Lake State Public Shooting Area, Florence SD Google Maps (accessed 1 February 2019)
- North Nichols State Public Shooting Area, Florence SD Google Maps (accessed 1 February 2019)
- North Stink Lake State Public Shooting Area, Henry SD Google Maps (accessed 1 February 2019)
- Pelican Lake State Recreation Area Google Maps (accessed 1 February 2019)
- Punished Womans Lake State Shooting Area, South Shore SD Google Maps (accessed 1 February 2019)
- Sandy Shore State Recreation Area Google Maps (accessed 1 February 2019)
- Spencer State Public Shooting Area, Henry SD Google Maps (accessed 1 February 2019)
- Spoonbill Pass State Public Shooting Area, Henry SD Google Maps (accessed 1 February 2019)
- Thompson's Point State Lakeside Use Area Google Maps (accessed 1 February 2019)
- Warner Lake State Public Shooting Area, Henry SD Google Maps (accessed 1 February 2019)
- Wolf State Public Shooting Area, Hazel SD Google Maps (accessed February 1, 2019)
- "Annual Estimates of the Resident Population for Counties: April 1, 2010 to July 1, 2019". Retrieved April 10, 2020.
- "US Decennial Census". US Census Bureau. Retrieved March 23, 2015.
- "Historical Census Browser". University of Virginia Library. Retrieved March 23, 2015.
- Forstall, Richard L., ed. (March 27, 1995). "Population of Counties by Decennial Census: 1900 to 1990". US Census Bureau. Retrieved March 23, 2015.
- "Census 2000 PHC-T-4. Ranking Tables for Counties: 1990 and 2000" (PDF). US Census Bureau. April 2, 2001. Retrieved March 23, 2015.
- "U.S. Census website". US Census Bureau. Retrieved May 14, 2011.
- "Profile of General Population and Housing Characteristics: 2010 Demographic Profile Data". US Census Bureau. Archived from the original on 13 February 2020. Retrieved 11 March 2016.
- "Population, Housing Units, Area, and Density: 2010 - County". US Census Bureau. Archived from the original on 13 February 2020. Retrieved 11 March 2016.
- "Selected Social Characteristics in the US – 2006-2010 American Community Survey 5-Year Estimates". US Census Bureau. Archived from the original on 13 February 2020. Retrieved 11 March 2016.
- "Selected Economic Characteristics – 2006-2010 American Community Survey 5-Year Estimates". US Census Bureau. Archived from the original on 13 February 2020. Retrieved 11 March 2016.
- Appleby SD Google Maps (accessed 1 February 2019)
- Rauville SD Google Maps (accessed 1 February 2019)
- Leip, David. "Atlas of US Presidential Elections". uselectionatlas.org. Retrieved 13 April 2018.
Places adjacent to Codington County, South Dakota | ||||||||||
|---|---|---|---|---|---|---|---|---|---|---|
| ||||||||||
Municipalities and communities of Codington County, South Dakota, United States | ||
|---|---|---|
| City | | |
| Towns | ||
| CDP | ||
| Unincorporated communities | ||
| Indian reservation | ||
| Footnotes | ‡This populated place also has portions in an adjacent county or counties | |
| ||

| Authority control |
|---|