Hanson County, South Dakota
Hanson County is a county in the U.S. state of South Dakota. As of the 2010 census, the population was 3,331.[1] Its county seat is Alexandria.[2] The county was founded in 1871 and organized in 1873.[3] It was named for Joseph R. Hanson, clerk of the first legislature.[4]
Hanson County | |
|---|---|
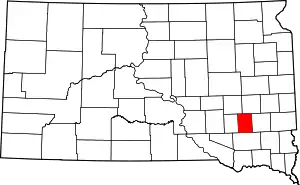 Location within the U.S. state of South Dakota | |
 South Dakota's location within the U.S. | |
| Coordinates: 43°40′N 97°47′W | |
| Country | |
| State | |
| Founded | 1871 (created) 1873 (organized) |
| Named for | Joseph R. Hanson |
| Seat | Alexandria |
| Largest city | Alexandria |
| Area | |
| • Total | 434.5 sq mi (1,125 km2) |
| • Land | 435.4 sq mi (1,128 km2) |
| • Water | 0.9 sq mi (2 km2) 0.2% |
| Population (2010) | |
| • Total | 3,331 |
| • Estimate (2018) | 3,376 |
| • Density | 7.7/sq mi (3.0/km2) |
| Time zone | UTC−6 (Central) |
| • Summer (DST) | UTC−5 (CDT) |
| Congressional district | At-large |
Hanson County is part of the Mitchell, SD Micropolitan Statistical Area.
Geography
The terrain of Hanson County consists of low rolling hills; its area is mostly devoted to agriculture. The James River flows southeastward through the lower western part of the county.[5] The terrain slopes toward the river basin on both sides, and generally gently slopes to the south.[6]
Hanson county has a total area of 435.3 square miles (1,127 km2), of which 434.5 square miles (1,125 km2) is land and 0.9 square miles (2.3 km2) (0.2%) is water.[7] It is the third-smallest county in South Dakota by area.
Major highways
Adjacent counties
- Miner County - north
- McCook County - east
- Hutchinson County - south
- Davison County - west
- Sanborn County - northwest
Demographics
| Historical population | |||
|---|---|---|---|
| Census | Pop. | %± | |
| 1880 | 1,301 | — | |
| 1890 | 4,267 | 228.0% | |
| 1900 | 4,947 | 15.9% | |
| 1910 | 6,237 | 26.1% | |
| 1920 | 6,202 | −0.6% | |
| 1930 | 6,131 | −1.1% | |
| 1940 | 5,400 | −11.9% | |
| 1950 | 4,896 | −9.3% | |
| 1960 | 4,584 | −6.4% | |
| 1970 | 3,781 | −17.5% | |
| 1980 | 3,415 | −9.7% | |
| 1990 | 2,994 | −12.3% | |
| 2000 | 3,139 | 4.8% | |
| 2010 | 3,331 | 6.1% | |
| 2019 (est.) | 3,453 | [8] | 3.7% |
| US Decennial Census[9] 1790-1960[10] 1900-1990[11] 1990-2000[12] 2010-2018[1] | |||
2000 census
As of the 2000 United States Census[13] there were 3,139 people, 1,115 households, and 848 families in the county. The population density was 7 people per square mile (3/km2). There were 1,218 housing units at an average density of 3 per square mile (1/km2). The racial makeup of the county was 99.52% White, 0.10% Native American, 0.13% Asian, 0.03% Pacific Islander, 0.03% from other races, and 0.19% from two or more races. 0.10% of the population were Hispanic or Latino of any race. Hanson County was mentioned as an "Extreme Whitopia" in Rich Benjamin's book, Searching for Whitopia.[14]
There were 1,115 households, out of which 34.40% had children under the age of 18 living with them, 70.40% were married couples living together, 3.70% had a female householder with no husband present, and 23.90% were non-families. 21.70% of all households were made up of individuals, and 11.60% had someone living alone who was 65 years of age or older. The average household size was 2.82 and the average family size was 3.33.
The county population contained 29.50% under the age of 18, 7.70% from 18 to 24, 26.10% from 25 to 44, 21.80% from 45 to 64, and 14.90% who were 65 years of age or older. The median age was 36 years. For every 100 females, there were 100.30 males. For every 100 females age 18 and over, there were 99.20 males.
The median income for a household in the county was $33,049, and the median income for a family was $39,500. Males had a median income of $27,112 versus $20,216 for females. The per capita income for the county was $14,778. About 12.50% of families and 16.60% of the population were below the poverty line, including 23.30% of those under age 18 and 15.30% of those age 65 or over.
2010 census
As of the 2010 United States Census, there were 3,331 people, 1,045 households, and 793 families in the county.[15] The population density was 7.7 inhabitants per square mile (3.0/km2). There were 1,177 housing units at an average density of 2.7 per square mile (1.0/km2).[16] The racial makeup of the county was 98.6% white, 0.3% Asian, 0.3% American Indian, 0.2% from other races, and 0.5% from two or more races. Those of Hispanic or Latino origin made up 0.5% of the population.[15] In terms of ancestry, 63.7% were German, 10.8% were Irish, 6.2% were English, 5.2% were Norwegian, and 4.0% were American.[17]
Of the 1,045 households, 35.0% had children under the age of 18 living with them, 68.8% were married couples living together, 3.5% had a female householder with no husband present, 24.1% were non-families, and 21.7% of all households were made up of individuals. The average household size was 2.69 and the average family size was 3.14. The median age was 35.5 years.[15]
The median income for a household in the county was $46,556 and the median income for a family was $52,425. Males had a median income of $38,088 versus $23,750 for females. The per capita income for the county was $21,391. About 13.8% of families and 13.7% of the population were below the poverty line, including 13.6% of those under age 18 and 13.8% of those age 65 or over.[18]
Communities
Cities
- Alexandria (county seat)
- Emery
Unincorporated community
- Epiphany[5]
- Rockport Colony
Townships
- Beulah
- Edgerton
- Emery
- Fairview
- Hanson
- Jasper
- Plano
- Rosedale
- Springlake
- Taylor
- Wayne
- Worthen
Politics
Hanson County voters tend to vote Republican. Since 1936, they have selected the Republican Party candidate in 65% of national elections.
| Year | Republican | Democratic | Third parties |
|---|---|---|---|
| 2020 | 75.1% 1,793 | 23.3% 557 | 1.6% 38 |
| 2016 | 74.6% 1,497 | 21.1% 424 | 4.2% 85 |
| 2012 | 67.3% 1,627 | 31.5% 760 | 1.2% 29 |
| 2008 | 58.7% 1,426 | 39.5% 961 | 1.8% 44 |
| 2004 | 64.1% 1,379 | 34.7% 745 | 1.2% 26 |
| 2000 | 66.4% 944 | 32.2% 457 | 1.4% 20 |
| 1996 | 52.2% 801 | 35.3% 541 | 12.5% 192 |
| 1992 | 36.4% 522 | 39.4% 566 | 24.2% 347 |
| 1988 | 50.0% 786 | 49.4% 776 | 0.6% 10 |
| 1984 | 58.7% 898 | 40.9% 625 | 0.5% 7 |
| 1980 | 58.8% 1,015 | 34.7% 598 | 6.5% 112 |
| 1976 | 40.6% 693 | 58.9% 1,005 | 0.5% 9 |
| 1972 | 46.0% 876 | 53.6% 1,022 | 0.4% 8 |
| 1968 | 50.1% 901 | 45.9% 826 | 4.0% 72 |
| 1964 | 39.4% 802 | 60.6% 1,232 | |
| 1960 | 48.5% 1,087 | 51.5% 1,153 | |
| 1956 | 46.9% 1,050 | 53.1% 1,187 | |
| 1952 | 63.1% 1,320 | 36.9% 773 | |
| 1948 | 47.1% 860 | 52.1% 953 | 0.8% 15 |
| 1944 | 55.3% 1,070 | 44.7% 864 | |
| 1940 | 53.7% 1,408 | 46.3% 1,216 | |
| 1936 | 40.3% 1,090 | 56.5% 1,530 | 3.3% 88 |
| 1932 | 31.9% 845 | 67.3% 1,783 | 0.8% 22 |
| 1928 | 58.1% 1,576 | 41.7% 1,129 | 0.2% 6 |
| 1924 | 40.5% 811 | 14.9% 299 | 44.6% 894 |
| 1920 | 51.9% 1,001 | 21.7% 418 | 26.5% 511 |
| 1916 | 51.1% 767 | 47.4% 712 | 1.5% 22 |
| 1912 | 0.0% 0 | 45.1% 632 | 55.0% 771 |
| 1908 | 48.7% 668 | 45.9% 630 | 5.4% 74 |
| 1904 | 55.8% 745 | 39.2% 523 | 5.1% 68 |
| 1900 | 49.1% 607 | 49.1% 607 | 1.9% 23 |
| 1896 | 38.8% 420 | 60.7% 658 | 0.6% 6 |
| 1892 | 36.2% 378 | 18.8% 196 | 45.0% 470 |
References
- "State & County QuickFacts". United States Census Bureau. Archived from the original on June 7, 2011. Retrieved November 25, 2013.
- "Find a County". National Association of Counties. Retrieved June 7, 2011.
- "Dakota Territory, South Dakota, and North Dakota: Individual County Chronologies". Dakota Territory Atlas of Historical County Boundaries. The Newberry Library. 2006. Retrieved March 29, 2015.
- Gannett, Henry (1905). The Origin of Certain Place Names in the United States. Govt. Print. Off. p. 149.
- Hanson County SD Google Maps (accessed February 3, 2019)
- ""Find an Altitude" Google Maps (accessed February 3, 2019)". Archived from the original on May 21, 2019. Retrieved February 4, 2019.
- "2010 Census Gazetteer Files". US Census Bureau. August 22, 2012. Retrieved March 26, 2015.
- "Annual Estimates of the Resident Population for Counties: April 1, 2010 to July 1, 2019". Retrieved April 10, 2020.
- "US Decennial Census". US Census Bureau. Retrieved March 26, 2015.
- "Historical Census Browser". University of Virginia Library. Retrieved March 26, 2015.
- Forstall, Richard L., ed. (March 27, 1995). "Population of Counties by Decennial Census: 1900 to 1990". US Census Bureau. Retrieved March 26, 2015.
- "Census 2000 PHC-T-4. Ranking Tables for Counties: 1990 and 2000" (PDF). US Census Bureau. April 2, 2001. Retrieved March 26, 2015.
- "U.S. Census website". US Census Bureau. Retrieved 14 May 2011.
- "Searching for Whitopia". Richbenjamin.com. Archived from the original on December 1, 2012.
- "DP-1 Profile of General Population and Housing Characteristics: 2010 Demographic Profile Data". US Census Bureau. Archived from the original on February 13, 2020. Retrieved March 12, 2016.
- "Population, Housing Units, Area, and Density: 2010 - County". US Census Bureau. Archived from the original on 13 February 2020. Retrieved 12 March 2016.
- "Selected Social Characteristics in the US – 2006-2010 American Community Survey 5-Year Estimates". US Census Bureau. Archived from the original on 13 February 2020. Retrieved 12 March 2016.
- "Selected Economic Characteristics – 2006-2010 American Community Survey 5-Year Estimates". US Census Bureau. Archived from the original on 13 February 2020. Retrieved 12 March 2016.
- Leip, David. "Atlas of US Presidential Elections". uselectionatlas.org. Retrieved 15 April 2018.
Places adjacent to Hanson County, South Dakota | ||||||||||
|---|---|---|---|---|---|---|---|---|---|---|
| ||||||||||
Municipalities and communities of Hanson County, South Dakota, United States | ||
|---|---|---|
| Cities | | |
| Towns | ||
| Unincorporated communities | ||
| ||

| Authority control |
|---|