Harding County, South Dakota
Harding County is a county in the U.S. state of South Dakota. As of the 2010 census, the population was 1,255,[1] making it the second-least populous county in South Dakota. Its county seat is Buffalo.[2]
Harding County | |
|---|---|
 | |
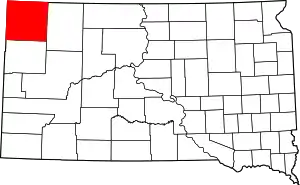 Location within the U.S. state of South Dakota | |
 South Dakota's location within the U.S. | |
| Coordinates: 45°35′N 103°30′W | |
| Country | |
| State | |
| Founded | 1881 (created) 1898 (dissolved) 1908 (re-created w revised shape) 1909 (organized) |
| Named for | J. A. Harding |
| Seat | Buffalo |
| Largest town | Buffalo |
| Area | |
| • Total | 2,678 sq mi (6,940 km2) |
| • Land | 2,671 sq mi (6,920 km2) |
| • Water | 6.5 sq mi (17 km2) 0.2% |
| Population (2010) | |
| • Total | 1,255 |
| • Estimate (2018) | 1,249 |
| • Density | 0.47/sq mi (0.18/km2) |
| Time zone | UTC−7 (Mountain) |
| • Summer (DST) | UTC−6 (MDT) |
| Congressional district | At-large |
| Website | www |
Harding County was established as a county in the Dakota Territory on 5 March 1881, but was not organized at that time. Its name recognized J. A. Harding, who had been Speaker of the House of Dakota Territory.[3] Its boundaries were altered in 1883, in 1889, and in 1894. On 8 November 1898, Harding County was dissolved and its territory assigned to Butte County. However, on 3 November 1908, it was again created (with altered boundaries) from Butte County's area, and on 17 February 1909 its governing organization was completed.[4]
Custer National Forest has its South Dakota portion in Harding County, and South Dakota State University operates the Antelope Range and Livestock Research Station about 14 miles (23 km) east of Buffalo.
Geography
Harding County lies at the northwest corner of South Dakota. Its western boundary line abuts the east boundary line of the state of Montana, and its north boundary line abuts the south boundary line of the state of North Dakota.[5] Its terrain consists of high hills, generally sloping to the east. Its highest point is a ridge that runs northwest to southeast near the county's southwest corner, at 3,366' (1026m) ASL.[6]
Harding County has a total area of 2,678 square miles (6,940 km2), of which 2,671 square miles (6,920 km2) is land and 6.5 square miles (17 km2) (0.2%) is water.[7] It is the fourth-largest county in South Dakota by area.
Major highways
Adjacent counties
- Bowman County, North Dakota - north
- Adams County, North Dakota - northeast
- Perkins County - east
- Butte County - south
- Carter County, Montana - west
- Fallon County, Montana - northwest
Protected areas[5]
- Custer National Forest (partial)
- Gardner Lake State Game Production Area
- Mallula State Game Production Area
- State Experiment Farm and Antelope Reserve
Lakes[5]
- Lake Gardner - it is 203 acres in surface area and is approximately 14 feet deep at its deepest point. Channel Catfish, Largemouth Bass, Walleye, Yellow Bullhead, and Yellow Perch inhabit the lake.
- Leger Dam
- Rabbit Creek Dam - this lake has a surface area of 17 acres and is inhabited by a variety of warm water fish including Largemouth Bass.
- Vesey Dam - Eight acres in size, this lake is stocked with rainbow trout.
Demographics
| Historical population | |||
|---|---|---|---|
| Census | Pop. | %± | |
| 1910 | 4,228 | — | |
| 1920 | 3,953 | −6.5% | |
| 1930 | 3,589 | −9.2% | |
| 1940 | 3,010 | −16.1% | |
| 1950 | 2,289 | −24.0% | |
| 1960 | 2,371 | 3.6% | |
| 1970 | 1,855 | −21.8% | |
| 1980 | 1,700 | −8.4% | |
| 1990 | 1,669 | −1.8% | |
| 2000 | 1,353 | −18.9% | |
| 2010 | 1,255 | −7.2% | |
| 2019 (est.) | 1,298 | [8] | 3.4% |
| US Decennial Census[9] 1790-1960[10] 1900-1990[11] 1990-2000[12] 2010-2018[1] | |||
2000 census
As of the 2000 United States Census,[13] there were 1,353 people, 525 households, and 352 families in the county. The population density was 0.5 people per square mile (0.2/km2). There were 804 housing units at an average density of 0.3 per square mile (0.1/km2). The racial makeup of the county, as defined by the US Census was 97.63% White, 0.30% Black or African American, 0.74% Native American, 0.59% Asian, 0.37% from other races, and 0.37% from two or more races. 1.63% of the population were Hispanic or Latino of any race. 25.9% were of German, 24.3% Norwegian, 12.8% American, 7.1% Irish and 6.6% English ancestry.
There were 525 households, out of which 35.0% had children under the age of 18 living with them, 58.5% were married couples living together, 5.3% had a female householder with no husband present, and 32.8% were non-families. 31.0% of all households were made up of individuals, and 14.5% had someone living alone who was 65 years of age or older. The average household size was 2.50 and the average family size was 3.19.
The county population contained 32.5% under the age of 18, 4.4% from 18 to 24, 24.8% from 25 to 44, 24.8% from 45 to 64, and 13.4% who were 65 years of age or older. The median age was 38 years. For every 100 females there were 104.7 males. For every 100 females age 18 and over, there were 102.0 males.
The median income for a household in the county was $25,000, and the median income for a family was $31,667. Males had a median income of $25,556 versus $16,375 for females. The per capita income for the county was $12,794. About 19.40% of families and 21.10% of the population were below the poverty line, including 22.80% of those under age 18 and 22.50% of those age 65 or over.
2010 census
As of the 2010 United States Census, there were 1,255 people, 539 households, and 348 families in the county.[14] The population density was 0.5 inhabitants per square mile (0.19/km2). There were 731 housing units at an average density of 0.27 per square mile (0.10/km2).[15] The racial makeup of the county was 95.9% white, 1.5% American Indian, 0.1% black or African American, 0.1% Asian, 0.7% from other races, and 1.7% from two or more races. Those of Hispanic or Latino origin made up 1.6% of the population.[14] In terms of ancestry, 41.4% were Norwegian, 31.8% were German, 18.4% were Irish, 13.2% were English, and 2.6% were American.[16]
Of the 539 households, 26.0% had children under the age of 18 living with them, 55.5% were married couples living together, 4.8% had a female householder with no husband present, 35.4% were non-families, and 32.1% of all households were made up of individuals. The average household size was 2.27 and the average family size was 2.87. The median age was 43.3 years.[14]
The median income for a household in the county was $34,792 and the median income for a family was $46,111. Males had a median income of $38,929 versus $20,924 for females. The per capita income for the county was $22,004. About 13.7% of families and 16.1% of the population were below the poverty line, including 19.5% of those under age 18 and 16.9% of those age 65 or over.[17]
Politics
Harding is a heavily Republican county in Presidential and Congressional elections. The last Democrat to win a majority in the county was Franklin D. Roosevelt in his 46-state 1936 landslide. Jimmy Carter in 1976 almost carried the county, but since then the solitary Democrat to top 22 percent of Harding County's ballots has been Michael Dukakis in the drought-influenced 1988 election – and none of the last seven Democratic presidential candidates have topped so much as twenty percent. In 2008, Republican John McCain won 78% of the county's vote, while in 2012 Mitt Romney won 86% of the vote, and Donald Trump in 2016 won 90%, his strongest showing in South Dakota, with Hillary Clinton narrowly securing second place from Gary Johnson.
| Year | Republican | Democratic | Third parties |
|---|---|---|---|
| 2020 | 92.0% 748 | 6.0% 49 | 2.0% 16 |
| 2016 | 90.3% 695 | 4.9% 38 | 4.8% 37 |
| 2012 | 86.3% 638 | 11.1% 82 | 2.6% 19 |
| 2008 | 78.3% 575 | 18.4% 135 | 3.3% 24 |
| 2004 | 86.4% 704 | 11.5% 94 | 2.1% 17 |
| 2000 | 88.9% 650 | 8.8% 64 | 2.3% 17 |
| 1996 | 68.4% 537 | 19.2% 151 | 12.4% 97 |
| 1992 | 58.5% 515 | 15.8% 139 | 25.8% 227 |
| 1988 | 70.3% 633 | 28.8% 259 | 0.9% 8 |
| 1984 | 79.3% 723 | 20.4% 186 | 0.3% 3 |
| 1980 | 74.6% 727 | 21.1% 205 | 4.3% 42 |
| 1976 | 49.7% 470 | 48.6% 459 | 1.7% 16 |
| 1972 | 71.6% 637 | 28.4% 253 | |
| 1968 | 63.0% 564 | 29.7% 266 | 7.3% 65 |
| 1964 | 50.1% 489 | 49.9% 487 | |
| 1960 | 63.9% 676 | 36.1% 382 | |
| 1956 | 63.4% 650 | 36.7% 376 | |
| 1952 | 73.4% 809 | 26.7% 294 | |
| 1948 | 50.9% 529 | 46.1% 479 | 3.1% 32 |
| 1944 | 52.8% 552 | 47.2% 493 | |
| 1940 | 53.0% 755 | 47.0% 670 | |
| 1936 | 37.9% 524 | 59.3% 819 | 2.8% 39 |
| 1932 | 43.3% 625 | 49.5% 715 | 7.2% 104 |
| 1928 | 72.8% 1,032 | 26.0% 368 | 1.3% 18 |
| 1924 | 62.1% 702 | 9.5% 107 | 28.5% 322 |
| 1920 | 58.4% 648 | 19.2% 213 | 22.4% 248 |
| 1916 | 41.6% 520 | 47.7% 597 | 10.7% 134 |
| 1912 | 29.5% 325 | 70.5% 777 |
In the South Dakota Senate Harding is part of the 28th Senate district, which is held by Republican Betty Olson. In the State House Harding is part of district 28B, which is held by Republican J. Sam Marty.
Communities
Towns
- Buffalo (county seat)
- Camp Crook
References
- "State & County QuickFacts". United States Census Bureau. Archived from the original on June 7, 2011. Retrieved November 25, 2013.
- "Find a County". National Association of Counties. Retrieved June 7, 2011.
- Joseph Nathan Kane, The American Counties (4th Ed.), (The Scarecrow Press, 1983), pp. 148, 479
- Individual County Chronologies/Harding County (Newberry Library) accessed February 3, 2019.
- Harding County SD Google Maps (accessed 3 February 2019)
- ""Find an Altitude" Google Maps (accessed February 3, 2019)". Archived from the original on May 21, 2019. Retrieved February 4, 2019.
- "2010 Census Gazetteer Files". US Census Bureau. August 22, 2012. Retrieved March 26, 2015.
- "Annual Estimates of the Resident Population for Counties: April 1, 2010 to July 1, 2019". Retrieved April 10, 2020.
- "US Decennial Census". US Census Bureau. Retrieved March 26, 2015.
- "Historical Census Browser". University of Virginia Library. Retrieved March 26, 2015.
- Forstall, Richard L., ed. (March 27, 1995). "Population of Counties by Decennial Census: 1900 to 1990". US Census Bureau. Retrieved March 26, 2015.
- "Census 2000 PHC-T-4. Ranking Tables for Counties: 1990 and 2000" (PDF). US Census Bureau. April 2, 2001. Retrieved March 26, 2015.
- "U.S. Census website". US Census Bureau. Retrieved May 14, 2011.
- "Profile of General Population and Housing Characteristics: 2010 Demographic Profile Data". US Census Bureau. Archived from the original on 13 February 2020. Retrieved 12 March 2016.
- "Population, Housing Units, Area, and Density: 2010 - County". US Census Bureau. Archived from the original on 13 February 2020. Retrieved 12 March 2016.
- "Selected Social Characteristics in the US – 2006-2010 American Community Survey 5-Year Estimates". U.S. Census Bureau. Archived from the original on February 13, 2020. Retrieved March 12, 2016.
- "Selected Economic Characteristics – 2006-2010 American Community Survey 5-Year Estimates". U.S. Census Bureau. Archived from the original on February 13, 2020. Retrieved March 12, 2016.
- Leip, David. "Atlas of US Presidential Elections". uselectionatlas.org. Retrieved 13 April 2018.
Places adjacent to Harding County, South Dakota | ||||||||||
|---|---|---|---|---|---|---|---|---|---|---|
| ||||||||||
Municipalities and communities of Harding County, South Dakota, United States | ||
|---|---|---|
| Towns | | |
| Unincorporated communities | ||
| Ghost towns | ||
| ||
