Meade County, South Dakota
Meade County is located in the U.S. state of South Dakota. As of the 2010 United States Census, the population was 25,434.[1] Its county seat is Sturgis.[2] The county was created in 1889 and was named for Fort Meade, which was garrisoned as a United States military post in the area in 1878 and itself named for General George Meade.[3]
Meade County | |
|---|---|
 | |
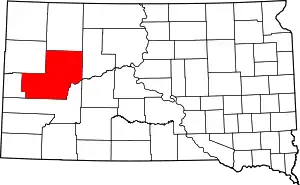 Location within the U.S. state of South Dakota | |
 South Dakota's location within the U.S. | |
| Coordinates: 44°34′N 102°43′W | |
| Country | |
| State | |
| Founded | February 7, 1889 |
| Named for | George Meade |
| Seat | Sturgis |
| Largest city | Sturgis |
| Area | |
| • Total | 3,483 sq mi (9,020 km2) |
| • Land | 3,471 sq mi (8,990 km2) |
| • Water | 12 sq mi (30 km2) 0.3% |
| Population (2010) | |
| • Total | 25,434 |
| • Estimate (2018) | 28,294 |
| • Density | 7.3/sq mi (2.8/km2) |
| Time zone | UTC−7 (Mountain) |
| • Summer (DST) | UTC−6 (MDT) |
| Congressional district | At-large |
| Website | www |
Meade County is part of the Rapid City, SD Metropolitan Statistical Area.
Geography
The upper part of Meade County is drained by Cherry Creek. The Cheyenne River flows northeastward along the southeast boundary of the county. The county terrain has mountain ridges in the west and southwest areas, with the remainder consisting of semi-arid rolling hills, partly dedicated to agriculture.[4] The county terrain slopes to the east and northeast; its highest point Flagstaff Mountain is near the SW corner, at 5,421' (1566m) ASL.[5]
The county has a total area of 3,483 square miles (9,020 km2), of which 3,471 square miles (8,990 km2) is land and 12 square miles (31 km2) (0.3%) is water.[6] It is the largest county by area in South Dakota.
Major highways
Adjacent counties
- Perkins County - north
- Ziebach County - east
- Haakon County -southeast
- Pennington County - south
- Lawrence County - southwest
- Butte County - northwest
Protected areas[4]
- Bear Butte Lake State Lakeside Use Area
- Bear Butte National Wildlife Refuge
- Bear Butte State Park
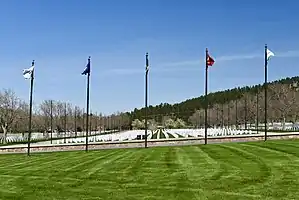
- Black Hills National Cemetery
- Black Hills National Forest (partial)
- Curlew Lake State Game Production Area
- Marcotte State Game Production Area
- Tisdale Lake State Game Production Area
- Opal Lake State Game Production Area
Lakes[4]
- Bear Butte Lake
- Belle Fourche Reservoir
Demographics
| Historical population | |||
|---|---|---|---|
| Census | Pop. | %± | |
| 1890 | 4,640 | — | |
| 1900 | 4,907 | 5.8% | |
| 1910 | 12,640 | 157.6% | |
| 1920 | 9,367 | −25.9% | |
| 1930 | 11,482 | 22.6% | |
| 1940 | 9,735 | −15.2% | |
| 1950 | 11,516 | 18.3% | |
| 1960 | 12,044 | 4.6% | |
| 1970 | 16,618 | 38.0% | |
| 1980 | 20,717 | 24.7% | |
| 1990 | 21,878 | 5.6% | |
| 2000 | 24,253 | 10.9% | |
| 2010 | 25,434 | 4.9% | |
| 2019 (est.) | 28,332 | [7] | 11.4% |
| US Decennial Census[8] 1790-1960[9] 1900-1990[10] 1990-2000[11] 2010-2018[1] | |||
2000 census
As of the 2000 United States Census,[12] there were 24,253 people, 8,805 households, and 6,700 families in the county. The population density was 7 people per square mile (3/km2). There were 10,149 housing units at an average density of 3 per square mile (1/km2). The racial makeup of the county was 92.65% White, 1.48% Black or African American, 2.04% Native American, 0.63% Asian, 0.07% Pacific Islander, 0.61% from other races, and 2.52% from two or more races. 2.10% of the population were Hispanic or Latino of any race.
There were 8,805 households, out of which 39.90% had children under the age of 18 living with them, 64.40% were married couples living together, 8.30% had a female householder with no husband present, and 23.90% were non-families. 19.90% of all households were made up of individuals, and 7.50% had someone living alone who was 65 years of age or older. The average household size was 2.66 and the average family size was 3.05.
The county population contained 28.40% under the age of 18, 10.60% from 18 to 24, 29.60% from 25 to 44, 21.00% from 45 to 64, and 10.40% who were 65 years of age or older. The median age was 33 years. For every 100 females, there were 102.20 males. For every 100 females age 18 and over, there were 101.60 males.
The median income for a household in the county was $36,992, and the median income for a family was $40,537. Males had a median income of $26,572 versus $20,517 for females. The per capita income for the county was $17,680. About 7.90% of families and 9.40% of the population were below the poverty line, including 11.80% of those under age 18 and 6.10% of those age 65 or over.
2010 census
As of the 2010 United States Census, there were 25,434 people, 9,903 households, and 7,067 families in the county.[13] The population density was 7.3 inhabitants per square mile (2.8/km2). There were 11,000 housing units at an average density of 3.2 per square mile (1.2/km2).[14] The racial makeup of the county was 92.0% white, 2.3% American Indian, 1.3% black or African American, 0.6% Asian, 0.1% Pacific islander, 0.8% from other races, and 2.9% from two or more races. Those of Hispanic or Latino origin made up 3.0% of the population.[13] In terms of ancestry, 40.5% were German, 15.3% were Irish, 13.2% were Norwegian, 11.3% were English, and 6.9% were American.[15]
Of the 9,903 households, 33.9% had children under the age of 18 living with them, 58.2% were married couples living together, 8.8% had a female householder with no husband present, 28.6% were non-families, and 23.6% of all households were made up of individuals. The average household size was 2.49 and the average family size was 2.93. The median age was 35.9 years.[13]
The median income for a household in the county was $46,180 and the median income for a family was $54,200. Males had a median income of $34,113 versus $27,548 for females. The per capita income for the county was $22,045. About 6.6% of families and 10.1% of the population were below the poverty line, including 12.1% of those under age 18 and 10.1% of those age 65 or over.[16]
Communities
Census-designated places
- Blackhawk
- Blucksberg Mountain
- Ellsworth AFB (former)
Unincorporated communities[4]
- Cedar Canyon
- Elm Springs
- Enning
- Fox Ridge
- Howes
- Maurine
- Mud Butte
- Redowl
- Tilford
- Union Center
- Viewfield
- White Owl
Townships
- Dakota
- Eagle
- Elm Springs
- Howard
- Lakeside
- Smithville
- Upper Red Owl
Unorganized territories
- Belle Fourche-Cheyenne Valleys
- North Meade
- Southwest Meade
Politics
Meade County voters are reliably Republican. In no national election since 1964 has the county selected the Democratic Party candidate.
| Year | Republican | Democratic | Third parties |
|---|---|---|---|
| 2020 | 72.2% 9,875 | 24.0% 3,285 | 3.7% 510 |
| 2016 | 72.6% 8,441 | 19.1% 2,223 | 8.2% 957 |
| 2012 | 70.0% 7,566 | 27.1% 2,928 | 3.0% 323 |
| 2008 | 64.8% 7,515 | 32.3% 3,751 | 2.9% 340 |
| 2004 | 72.6% 8,347 | 25.6% 2,941 | 1.9% 216 |
| 2000 | 73.4% 6,870 | 24.2% 2,267 | 2.5% 229 |
| 1996 | 54.3% 4,984 | 32.3% 2,960 | 13.4% 1,232 |
| 1992 | 46.9% 4,724 | 26.7% 2,694 | 26.4% 2,657 |
| 1988 | 61.2% 5,189 | 37.9% 3,212 | 0.9% 72 |
| 1984 | 73.5% 5,908 | 26.0% 2,093 | 0.5% 40 |
| 1980 | 70.9% 5,349 | 22.8% 1,721 | 6.3% 471 |
| 1976 | 54.4% 3,096 | 43.6% 2,478 | 2.0% 116 |
| 1972 | 67.2% 3,416 | 32.2% 1,633 | 0.6% 31 |
| 1968 | 56.2% 2,392 | 35.8% 1,522 | 8.1% 343 |
| 1964 | 48.0% 2,140 | 52.1% 2,323 | |
| 1960 | 57.9% 2,644 | 42.1% 1,923 | |
| 1956 | 59.8% 2,467 | 40.2% 1,658 | |
| 1952 | 70.0% 3,109 | 30.0% 1,334 | |
| 1948 | 54.5% 2,053 | 44.6% 1,681 | 0.9% 35 |
| 1944 | 62.2% 1,912 | 37.8% 1,164 | |
| 1940 | 57.0% 2,560 | 43.0% 1,931 | |
| 1936 | 44.7% 2,064 | 49.9% 2,304 | 5.4% 248 |
| 1932 | 37.7% 1,735 | 58.3% 2,687 | 4.0% 186 |
| 1928 | 66.0% 2,845 | 33.5% 1,441 | 0.5% 22 |
| 1924 | 57.4% 2,006 | 22.5% 786 | 20.1% 701 |
| 1920 | 58.4% 1,894 | 27.6% 894 | 14.1% 457 |
| 1916 | 38.3% 858 | 54.6% 1,224 | 7.2% 161 |
| 1912 | 43.7% 975 | 56.3% 1,255 | |
| 1908 | 51.2% 953 | 42.6% 792 | 6.2% 115 |
| 1904 | 65.8% 754 | 23.4% 268 | 10.8% 124 |
| 1900 | 48.9% 550 | 50.2% 565 | 0.9% 10 |
| 1896 | 40.6% 550 | 59.1% 802 | 0.3% 4 |
| 1892 | 36.6% 427 | 11.0% 128 | 52.5% 613 |
References
- "State & County QuickFacts". United States Census Bureau. Archived from the original on June 7, 2011. Retrieved November 25, 2013.
- "Find a County". National Association of Counties. Retrieved June 7, 2011.
- Andrews, John (June 14, 2016). "Cattle and Hogs". South Dakota Magazine.
- Meade County SD Google Maps (accessed 6 February 2019)
- ""Find an Altitude" Google Maps (accessed 6 February 2019)". Archived from the original on May 21, 2019. Retrieved February 7, 2019.
- "2010 Census Gazetteer Files". US Census Bureau. August 22, 2012. Retrieved March 28, 2015.
- "Annual Estimates of the Resident Population for Counties: April 1, 2010 to July 1, 2019". Retrieved April 10, 2020.
- "US Decennial Census". US Census Bureau. Retrieved March 28, 2015.
- "Historical Census Browser". University of Virginia Library. Retrieved March 28, 2015.
- Forstall, Richard L., ed. (March 27, 1995). "Population of Counties by Decennial Census: 1900 to 1990". US Census Bureau. Retrieved March 28, 2015.
- "Census 2000 PHC-T-4. Ranking Tables for Counties: 1990 and 2000" (PDF). US Census Bureau. April 2, 2001. Retrieved March 28, 2015.
- "U.S. Census website". US Census Bureau. Retrieved May 14, 2011.
- "Profile of General Population and Housing Characteristics: 2010 Demographic Profile Data". US Census Bureau. Archived from the original on February 13, 2020. Retrieved March 12, 2016.
- "Population, Housing Units, Area, and Density: 2010 - County". US Census Bureau. Archived from the original on February 13, 2020. Retrieved March 12, 2016.
- "Selected Social Characteristics in the US – 2006-2010 American Community Survey 5-Year Estimates". US Census Bureau. Archived from the original on February 13, 2020. Retrieved March 12, 2016.
- "Selected Economic Characteristics – 2006-2010 American Community Survey 5-Year Estimates". US Census Bureau. Archived from the original on February 13, 2020. Retrieved March 12, 2016.
- Leip, David. "Atlas of US Presidential Elections". uselectionatlas.org. Retrieved April 15, 2018.
External links
Places adjacent to Meade County, South Dakota | ||||||||||
|---|---|---|---|---|---|---|---|---|---|---|
| ||||||||||
Municipalities and communities of Meade County, South Dakota, United States | ||
|---|---|---|
| Cities | Meade County map | |
| CDPs | ||
| Former CDP | ||
| Unincorporated communities | ||
| Indian reservations | ||
| Ghost towns | ||
| Footnotes | ‡This populated place also has portions in an adjacent county or counties | |
| ||

| Authority control |
|---|