Perkins County, South Dakota
Perkins County is a county in the U.S. state of South Dakota. As of the 2010 census, the population was 2,982.[1] Its county seat is Bison.[2] The county was established in 1908 and organized in 1909.[3] It was named for Sturgis, South Dakota, official Henry E. Perkins.[4]
Perkins County | |
|---|---|
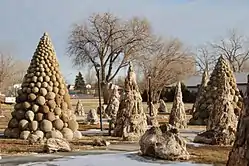 Petrified Wood Park in Lemmon, South Dakota | |
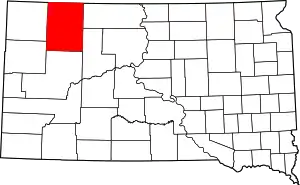 Location within the U.S. state of South Dakota | |
 South Dakota's location within the U.S. | |
| Coordinates: 45°30′N 102°29′W | |
| Country | |
| State | |
| Founded | November 3, 1908 (established) 1909 (organized) |
| Named for | Henry E. Perkins |
| Seat | Bison |
| Largest city | Lemmon |
| Area | |
| • Total | 2,891 sq mi (7,490 km2) |
| • Land | 2,870 sq mi (7,400 km2) |
| • Water | 20 sq mi (50 km2) 0.7% |
| Population (2010) | |
| • Total | 2,982 |
| • Estimate (2018) | 2,922 |
| • Density | 1.0/sq mi (0.40/km2) |
| Time zone | UTC−7 (Mountain) |
| • Summer (DST) | UTC−6 (MDT) |
| Congressional district | At-large |
| Website | www |
Geography
Perkins County lies on the north edge of South Dakota. Its north boundary line abuts the south boundary line of the state of North Dakota. The Grand River flows eastward through the upper part of the county, and the Moreau River flows eastward through the lower part of the county. Shadehill Reservoir is a large impoundment on the Grand River in the county.
Perkins County terrain consists of semi-arid rolling hills, carved by drainage creeks, sparsely dedicated to agriculture.[5] The terrain slopes to the east; its highest point is on its lower west boundary line, at 3,097' (944m) ASL.[6] The county has a total area of 2,890 square miles (7,500 km2), of which 2,870 square miles (7,400 km2) is land and 20 square miles (52 km2) (0.7%) is water.[7] It is the second-largest county by area in South Dakota. Meade County is the state's largest county by area.
Perkins County came to media attention in 2009 when Stephen Von Worley calculated that it was the site of the "McFarthest Spot" — the point in the continental United States that is most distant from a McDonald's restaurant: 107 mi (172 km) as the crow flies and 145 mi (233 km) by car.[8][9][10]
Major highways
 U.S. Highway 12
 South Dakota Highway 20
 South Dakota Highway 73
 South Dakota Highway 75
Adjacent counties
- Adams County, North Dakota - north
- Corson County - east
- Ziebach County - southeast
- Meade County - south
- Butte County - southwest
- Harding County - west
Protected areas[5]
- Grand River National Grassland (part)[11]
- Hugh Glass State Lakeside Use Area
- Lemmon Lake State Game Production Area
- Llewellyn Johns State Recreation Area
- Owens Lake State Game Production Area
- Shadehill State Game Production Area
- Shadehill State Recreation Area
- Sorum Dam State Game Production Area
- Vobejda Lake State Game Production Area
Lakes[5]
- Flat Creek Lake
- Lemmon Lake
- Owens Lake
- Shadehill Reservoir
- Sorum Dam
- Vobejda Dam
Demographics
| Historical population | |||
|---|---|---|---|
| Census | Pop. | %± | |
| 1910 | 11,348 | — | |
| 1920 | 7,993 | −29.6% | |
| 1930 | 8,717 | 9.1% | |
| 1940 | 6,585 | −24.5% | |
| 1950 | 6,776 | 2.9% | |
| 1960 | 5,977 | −11.8% | |
| 1970 | 4,769 | −20.2% | |
| 1980 | 4,700 | −1.4% | |
| 1990 | 3,932 | −16.3% | |
| 2000 | 3,363 | −14.5% | |
| 2010 | 2,982 | −11.3% | |
| 2019 (est.) | 2,865 | [12] | −3.9% |
| US Decennial Census[13] 1790-1960[14] 1900-1990[15] 1990-2000[16] 2010-2018[1] | |||
2000 census
As of the 2000 United States Census,[17] there were 3,363 people, 1,429 households, and 937 families in the county. The population density was 1.2 people per square mile (0.5/km2). There were 1,854 housing units at an average density of 0.6 per square mile (0.25/km2). The racial makeup of the county was 96.64% White, 0.15% Black or African American, 1.64% Native American, 0.24% Asian, 0.51% from other races, and 0.83% from two or more races. 0.74% of the population were Hispanic or Latino of any race.
There were 1,429 households, 27.3% of which had children under the age of 18 living with them, 57.8% were married couples living together, 5.2% had a female householder with no husband present, and 34.4% were non-families. 32.9% of all households were made up of individuals, and 17.5% had someone living alone who was 65 years of age or older. The average household size was 2.31 and the average family size was 2.93.
The county population contained 24.1% under the age of 18, 5.6% from 18 to 24, 23.4% from 25 to 44, 23.2% from 45 to 64, and 23.7% who were 65 years of age or older. The median age was 43 years. For every 100 females there were 96.3 males. For every 100 females age 18 and over, there were 96.3 males.
The median income for a household in the county was $27,750, and the median income for a family was $33,537. Males had a median income of $23,665 versus $16,856 for females. The per capita income for the county was $15,734. About 12.40% of families and 16.90% of the population were below the poverty line, including 21.60% of those under age 18 and 14.50% of those age 65 or over.
2010 census
As of the 2010 United States Census, there were 2,982 people, 1,291 households, and 838 families in the county.[18] The population density was 1.0 inhabitant per square mile (0.39/km2). There were 1,739 housing units at an average density of 0.6 per square mile (0.23/km2).[19] The racial makeup of the county was 96.9% white, 1.3% American Indian, 0.1% black or African American, 0.1% Asian, 0.5% from other races, and 1.1% from two or more races. Those of Hispanic or Latino origin made up 0.7% of the population.[18] In terms of ancestry, 47.4% were German, 26.2% were Norwegian, 10.8% were English, 8.7% were Irish, 8.4% were Swedish, and 5.8% were American.[20]
Of the 1,291 households, 24.0% had children under the age of 18 living with them, 57.2% were married couples living together, 4.9% had a female householder with no husband present, 35.1% were non-families, and 32.0% of all households were made up of individuals. The average household size was 2.26 and the average family size was 2.85. The median age was 48.5 years.[18]
The median income for a household in the county was $33,361 and the median income for a family was $55,313. Males had a median income of $30,255 versus $27,361 for females. The per capita income for the county was $25,780. About 11.2% of families and 18.7% of the population were below the poverty line, including 25.6% of those under age 18 and 21.2% of those age 65 or over.[21]
Communities
Census-designated place
Unincorporated Communities
Ghost Towns
Townships
- Ada
- Anderson
- Antelope
- Barrett
- Beck
- Bison
- Brushy
- Burdick
- Cash
- Castle Butte
- Chance
- Chaudoin
- Clark
- De Witt
- Duell
- Englewood
- Flat Creek
- Foster
- Fredlund
- Glendo
- Grand River
- Hall
- Highland
- Horse Creek
- Liberty
- Lincoln
- Lemmon
- Lodgepole
- Lone Tree
- Maltby
- Marshfield
- Martin
- Meadow
- Moreau
- Plateau
- Rainbow
- Rockford
- Scotch Cap
- Sidney
- Strool
- Trail
- Vail
- Vickers
- Viking
- Vrooman
- Wells
- White Butte
- White Hill
- Wilson
- Wyandotte
Unorganized territories
- Duck Creek
- East Perkins
- Independence
- Pleasant Valley
- South Perkins
- Southwest Perkins
- West Central Perkins
- West Perkins
Politics
Like most of South Dakota, Perkins County is overwhelmingly Republican. No Democratic presidential candidate has won Perkins County since Franklin D. Roosevelt did so during his 46-state landslide in 1936. Jimmy Carter in 1976 came within 36 votes of carrying the county, but since then the only Democrat to gain even 29 percent of the county's vote has been Michael Dukakis during the drought-affected 1988 election.
| Year | Republican | Democratic | Third parties |
|---|---|---|---|
| 2020 | 83.9% 1,401 | 14.3% 239 | 1.7% 29 |
| 2016 | 83.9% 1,401 | 14.3% 239 | 1.7% 29 |
| 2016 | 83.0% 1,333 | 11.7% 188 | 5.3% 85 |
| 2012 | 75.8% 1,205 | 20.1% 319 | 4.2% 66 |
| 2008 | 65.4% 1,102 | 29.6% 499 | 5.0% 85 |
| 2004 | 73.3% 1,329 | 23.1% 418 | 3.6% 66 |
| 2000 | 76.6% 1,237 | 18.4% 297 | 5.0% 80 |
| 1996 | 58.1% 983 | 27.2% 460 | 14.7% 249 |
| 1992 | 43.8% 872 | 28.4% 566 | 27.8% 553 |
| 1988 | 60.4% 1,326 | 38.7% 851 | 0.9% 20 |
| 1984 | 69.9% 1,686 | 29.6% 714 | 0.5% 11 |
| 1980 | 72.7% 1,931 | 22.4% 595 | 4.9% 129 |
| 1976 | 50.1% 1,298 | 48.7% 1,262 | 1.2% 32 |
| 1972 | 65.1% 1,691 | 34.6% 900 | 0.3% 7 |
| 1968 | 60.4% 1,498 | 35.0% 869 | 4.6% 114 |
| 1964 | 52.9% 1,409 | 47.1% 1,255 | |
| 1960 | 60.3% 1,767 | 39.7% 1,164 | |
| 1956 | 59.4% 1,743 | 40.6% 1,191 | |
| 1952 | 71.8% 2,160 | 28.2% 849 | |
| 1948 | 55.0% 1,424 | 42.4% 1,096 | 2.6% 67 |
| 1944 | 57.1% 1,325 | 42.9% 995 | |
| 1940 | 57.4% 1,777 | 42.6% 1,321 | |
| 1936 | 41.1% 1,408 | 56.6% 1,940 | 2.3% 77 |
| 1932 | 40.9% 1,406 | 53.9% 1,852 | 5.2% 180 |
| 1928 | 68.6% 2,262 | 30.6% 1,010 | 0.8% 27 |
| 1924 | 59.2% 1,421 | 11.5% 277 | 29.3% 702 |
| 1920 | 60.4% 1,326 | 19.0% 417 | 20.6% 452 |
| 1916 | 45.4% 890 | 47.9% 939 | 6.7% 131 |
| 1912 | 39.6% 832 | 60.4% 1,269 |
References
- "State & County QuickFacts". United States Census Bureau. Archived from the original on June 7, 2011. Retrieved November 28, 2013.
- "Find a County". National Association of Counties. Retrieved June 7, 2011.
- "Dakota Territory, South Dakota, and North Dakota: Individual County Chronologies". Dakota Territory Atlas of Historical County Boundaries. The Newberry Library. 2006. Retrieved March 31, 2015.
- Hellmann, Paul T. (May 13, 2013). Historical Gazetteer of the United States. Routledge. p. 983. ISBN 978-1135948597. Retrieved November 30, 2013.
- Perkins County SD Google Maps (accessed 8 February 2019)
- ""Find an Altitude" Google Maps (accessed 8 February 2019)". Archived from the original on May 21, 2019. Retrieved February 8, 2019.
- "2010 Census Gazetteer Files". US Census Bureau. August 22, 2012. Retrieved March 28, 2015.
- https://www.huffpost.com/entry/a-mcdonalds-is-never-more_n_297153
- https://www.telegraph.co.uk/news/newstopics/howaboutthat/6380193/McFarthest-point-in-the-US-from-a-McDonalds.html
- http://www.datapointed.net/2009/09/distance-to-nearest-mcdonalds/
- Map of the Grand River National Grassland
- "Annual Estimates of the Resident Population for Counties: April 1, 2010 to July 1, 2019". Retrieved April 10, 2020.
- "US Decennial Census". US Census Bureau. Retrieved March 28, 2015.
- "Historical Census Browser". University of Virginia Library. Retrieved March 28, 2015.
- Forstall, Richard L., ed. (March 27, 1995). "Population of Counties by Decennial Census: 1900 to 1990". US Census Bureau. Retrieved March 28, 2015.
- "Census 2000 PHC-T-4. Ranking Tables for Counties: 1990 and 2000" (PDF). US Census Bureau. April 2, 2001. Retrieved March 28, 2015.
- "U.S. Census website". US Census Bureau. Retrieved May 14, 2011.
- "Profile of General Population and Housing Characteristics: 2010 Demographic Profile Data". US Census Bureau]]. Archived from the original on February 13, 2020. Retrieved March 12, 2016.
- "Population, Housing Units, Area, and Density: 2010 - County". US Census Bureau. Archived from the original on February 13, 2020. Retrieved March 12, 2016.
- "Selected Social Characteristics in the US – 2006-2010 American Community Survey 5-Year Estimates". US Census Bureau. Archived from the original on February 13, 2020. Retrieved March 12, 2016.
- "Selected Economic Characteristics – 2006-2010 American Community Survey 5-Year Estimates". US Census Bureau. Archived from the original on February 13, 2020. Retrieved March 12, 2016.
- Leip, David. "Atlas of US Presidential Elections". uselectionatlas.org. Retrieved April 15, 2018.
| Wikimedia Commons has media related to Perkins County, South Dakota. |
Places adjacent to Perkins County, South Dakota | ||||||||||
|---|---|---|---|---|---|---|---|---|---|---|
| ||||||||||
Municipalities and communities of Perkins County, South Dakota, United States | ||
|---|---|---|
| City | | |
| Town | ||
| Townships |
| |
| CDP | ||
| Other unincorporated communities | ||
| Ghost towns | ||
| Indian reservation | ||
| Footnotes | ‡This populated place also has portions in an adjacent county or counties | |
| ||
