Aurora County, South Dakota
Aurora County is a county in the U.S. state of South Dakota. As of the 2010 United States Census, the population was 2,710.[1] Its county seat is Plankinton.[2] The county was created in 1879, and was organized in 1881.[3]
Aurora County | |
|---|---|
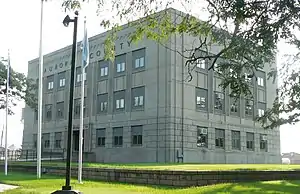 Aurora County courthouse in Plankinton | |
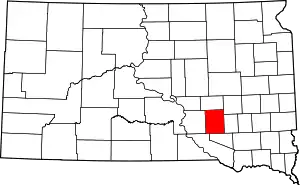 Location within the U.S. state of South Dakota | |
 South Dakota's location within the U.S. | |
| Coordinates: 43°43′N 98°34′W | |
| Country | |
| State | |
| Founded | 1879 (created) 1881 (organized) |
| Named for | Aurora, a Roman goddess |
| Seat | Plankinton |
| Largest city | Plankinton |
| Area | |
| • Total | 713 sq mi (1,850 km2) |
| • Land | 708 sq mi (1,830 km2) |
| • Water | 4.3 sq mi (11 km2) 0.6% |
| Population (2010) | |
| • Total | 2,710 |
| • Estimate (2018) | 2,801 |
| • Density | 3.8/sq mi (1.5/km2) |
| Time zone | UTC−6 (Central) |
| • Summer (DST) | UTC−5 (CDT) |
| Congressional district | At-large |
History
Aurora County, named for Aurora, the Roman goddess of the dawn, was created by the Dakota Territory on 1 October 1879.[4] It was organized on 29 August 1881, when three county commissioners were appointed. The county had been established from the combination of former counties Cragin and Wetmore, which had both been formed in 1873. The three county commissioners met on 29 August 1881, and named Plankinton the county seat, an act which was ratified by voters in November 1882. The northern portion of Aurora County was partitioned off on April 17, 1883, and established as Jerauld County.[5]
Geography
The terrain of Aurora County consists of low rolling hills, partially devoted to agriculture. It is dotted with small lakes and ponds.[6] The highest point is the upper west boundary line, and the terrain slopes east-northeastward; the lowest point is the county's northeast corner at 1,325' (404m) ASL.[7]
The county has a total area of 713 square miles (1,850 km2), of which 708 square miles (1,830 km2) is land and 4.3 square miles (11 km2) (0.6%) is water.[8]
Major highways
 Interstate 90
 U.S. Highway 281
 South Dakota Highway 42
Adjacent counties
- Jerauld County - north
- Sanborn County - northeast
- Davison County - east
- Douglas County - south
- Charles Mix County - southwest
- Brule County - west
Protected areas
- Crystal Lake Public Shooting Area[9]
- Hanson Lake State Public Shooting Area[10]
- Kimball State Public Shooting Area[11]
- Koch Waterfowl Production Area[12]
- Kramer Slaugh Public Shooting Area[13]
- Krell Waterfowl Production Area[14]
- Lutz Waterfowl Production Area[15]
- Maine Waterfowl Production Area[16]
- National Waterfowl Production Area[17]
- Pleasant Lake State Public Shooting Area[18]
- Schute Waterfowl Production Area[19]
- Sorenson Waterfowl Production Area[20]
- Wilmarth Lake Game Production Area[21]
Demographics
| Historical population | |||
|---|---|---|---|
| Census | Pop. | %± | |
| 1880 | 69 | — | |
| 1890 | 5,045 | 7,211.6% | |
| 1900 | 4,011 | −20.5% | |
| 1910 | 6,143 | 53.2% | |
| 1920 | 7,246 | 18.0% | |
| 1930 | 7,139 | −1.5% | |
| 1940 | 5,387 | −24.5% | |
| 1950 | 5,020 | −6.8% | |
| 1960 | 4,749 | −5.4% | |
| 1970 | 4,183 | −11.9% | |
| 1980 | 3,628 | −13.3% | |
| 1990 | 3,136 | −13.6% | |
| 2000 | 3,058 | −2.5% | |
| 2010 | 2,710 | −11.4% | |
| 2019 (est.) | 2,751 | [22] | 1.5% |
| US Decennial Census[23] 1790-1960[24] 1900-1990[25] 1990-2000[26] 2010-2018[1] | |||
2000 census
As of the 2000 United States Census,[27] there were 3,058 people, 1,165 households, and 816 families in the county. The population density was 4 people per square mile (2/km2). There were 1,298 housing units at an average density of 2 per square mile (1/km2). The racial makeup of the county was 95.68% White, 0.29% Black or African American, 1.93% Native American, 0.10% Asian, 1.44% from other races, and 0.56% from two or more races. 2.09% of the population were Hispanic or Latino of any race. 48.0% were of German, 13.0% Dutch, 6.9% Norwegian, 6.6% English, 6.1% Irish and 5.8% United States or American ancestry.
There were 1,165 households, out of which 29.70% had children under the age of 18 living with them, 61.30% were married couples living together, 5.00% had a female householder with no husband present, and 29.90% were non-families. 28.20% of all households were made up of individuals, and 14.70% had someone living alone who was 65 years of age or older. The average household size was 2.45 and the average family size was 3.02.
The county population contained 27.60% under the age of 18, 6.50% from 18 to 24, 22.10% from 25 to 44, 22.20% from 45 to 64, and 21.60% who were 65 years of age or older. The median age was 41 years. For every 100 females there were 104.30 males. For every 100 females age 18 and over, there were 98.80 males.
The median income for a household in the county was $29,783, and the median income for a family was $37,227. Males had a median income of $25,786 versus $21,250 for females. The per capita income for the county was $13,887. About 7.80% of families and 11.40% of the population were below the poverty line, including 13.40% of those under age 18 and 12.00% of those age 65 or over.
2010 census
As of the 2010 United States Census, there were 2,710 people, 1,102 households, and 736 families residing in the county.[28] The population density was 3.8 inhabitants per square mile (1.5/km2). There were 1,324 housing units at an average density of 1.9 per square mile (0.73/km2).[29] The racial makeup of the county was 95.1% white, 1.5% American Indian, 0.7% Asian, 0.4% black or African American, 1.8% from other races, and 0.5% from two or more races. Those of Hispanic or Latino origin made up 3.7% of the population.[28] In terms of ancestry, 54.3% were German, 13.7% were Dutch, 11.8% were Norwegian, 8.7% were Irish, 7.2% were English, and 4.9% were American.[30]
Of the 1,102 households, 28.3% had children under the age of 18 living with them, 57.5% were married couples living together, 5.4% had a female householder with no husband present, 33.2% were non-families, and 29.9% of all households were made up of individuals. The average household size was 2.37 and the average family size was 2.96. The median age was 43.2 years.[28]
The median income for a household in the county was $45,230 and the median income for a family was $55,588. Males had a median income of $30,185 versus $27,206 for females. The per capita income for the county was $21,291. About 4.5% of families and 8.2% of the population were below the poverty line, including 7.4% of those under age 18 and 12.8% of those age 65 or over.[31]
Communities
Cities
- Plankinton (county seat)
- White Lake
Town
Census-designated places
Townships
- Aurora Township
- Belford Township
- Bristol Township
- Center Township
- Cooper Township
- Crystal Lake Township
- Dudley Township
- Eureka Township
- Firesteel Township
- Gales Township
- Hopper Township
- Lake Township
- Palatine Township
- Patten Township
- Plankinton Township
- Pleasant Lake Township
- Pleasant Valley Township
- Truro Township
- Washington Township
- White Lake Township
Politics
Aurora County at one time favoured the Democratic Party and was one of just 130 counties nationwide to be won by South Dakota favorite son George McGovern, who grew up in adjacent Davison County. However, with the “Reagan Revolution” of the 1980s it has gradually turned into a strongly Republican county. The last Democrat to win a majority in Aurora County was Michael Dukakis during the drought- and farm crisis-affected 1988 election, and although Bill Clinton won a plurality in 1992, the county has since become as solidly Republican as most rural white counties in the US due to perceived lack of economic opportunity and differences with the Democratic Party's liberal views on social issues. Both George W. Bush in 2000 and 2004 as well as Donald Trump in 2016 beat the previous best GOP performance in Aurora County by substantial margins.
| Year | Republican | Democratic | Third parties |
|---|---|---|---|
| 2020 | 74.9% 1,052 | 22.6% 317 | 2.6% 36 |
| 2016 | 69.2% 974 | 24.2% 340 | 6.6% 93 |
| 2012 | 57.4% 804 | 39.7% 556 | 2.9% 40 |
| 2008 | 53.1% 794 | 43.8% 655 | 3.1% 46 |
| 2004 | 61.2% 1,009 | 37.6% 620 | 1.2% 20 |
| 2000 | 59.9% 847 | 36.3% 513 | 3.8% 53 |
| 1996 | 44.7% 709 | 41.8% 664 | 13.5% 214 |
| 1992 | 34.7% 594 | 39.7% 680 | 25.6% 438 |
| 1988 | 46.2% 856 | 53.2% 987 | 0.6% 11 |
| 1984 | 54.7% 1,029 | 44.6% 840 | 0.7% 14 |
| 1980 | 58.9% 1,251 | 33.4% 709 | 7.7% 163 |
| 1976 | 39.4% 831 | 60.2% 1,269 | 0.4% 9 |
| 1972 | 46.0% 1,075 | 53.7% 1,257 | 0.3% 7 |
| 1968 | 46.7% 1,043 | 47.5% 1,060 | 5.8% 130 |
| 1964 | 35.9% 871 | 64.1% 1,555 | |
| 1960 | 49.9% 1,267 | 50.1% 1,270 | |
| 1956 | 43.4% 1,055 | 56.6% 1,374 | |
| 1952 | 59.4% 1,458 | 40.6% 997 | |
| 1948 | 45.0% 1,056 | 54.3% 1,275 | 0.7% 16 |
| 1944 | 53.5% 1,163 | 46.5% 1,011 | |
| 1940 | 50.4% 1,408 | 49.6% 1,385 | |
| 1936 | 36.5% 1,082 | 60.8% 1,801 | 2.7% 80 |
| 1932 | 26.7% 860 | 71.6% 2,304 | 1.7% 55 |
| 1928 | 51.7% 1,552 | 47.5% 1,426 | 0.8% 23 |
| 1924 | 36.3% 967 | 25.0% 665 | 38.7% 1,031 |
| 1920 | 49.2% 1,004 | 21.8% 445 | 29.0% 592 |
| 1916 | 46.1% 735 | 49.7% 793 | 4.3% 68 |
| 1912 | 51.2% 801 | 48.8% 763 | |
| 1908 | 47.9% 686 | 48.5% 694 | 3.6% 52 |
| 1904 | 58.8% 652 | 36.7% 407 | 4.5% 50 |
| 1900 | 49.8% 503 | 48.1% 486 | 2.2% 22 |
| 1896 | 44.1% 387 | 54.6% 479 | 1.4% 12 |
| 1892 | 47.0% 461 | 21.1% 207 | 32.0% 314 |
References
- "State & County QuickFacts". US Census Bureau. Archived from the original on July 6, 2011. Retrieved November 26, 2013.
- "Find a County". National Association of Counties. Archived from the original on May 31, 2011. Retrieved June 7, 2011.
- "Dakota Territory, South Dakota, and North Dakota: Individual County Chronologies". Dakota Territory Atlas of Historical County Boundaries. The Newberry Library. 2006. Retrieved March 28, 2015.
- Soil Survey of Aurora County, South Dakota. US Dept. of Agriculture. 1980. p. 2.
- Long, John H. (2006). "Dakota Territory, South Dakota, and North Dakota: Individual County Chronologies". Dakota Territory Atlas of Historical County Boundaries. The Newberry Library. Archived from the original on November 11, 2007. Retrieved January 30, 2019.
- Aurora County SD Google Maps (accessed 30 January 2019)
- ""Find an Altitude" Google Maps (accessed 30 January 2019)". Archived from the original on 21 May 2019. Retrieved 30 January 2019.
- "2010 Census Gazetteer Files". US Census Bureau. August 22, 2012. Retrieved March 22, 2015.
- Crystal Lake Public Shooting Area, Stickney SD Google Maps (accessed 30 January 2019)
- Hanson Lake State Public Shooting Area Google Maps (accessed 30 January 2019)
- Kimball State Public Shooting Area Google Maps (accessed 30 January 2019)
- Koch Waterfowl Production Area Google Maps (accessed 30 January 2019)
- Kramer Slaugh Public Shooting Area, White Lake SD Google Maps (accessed 30 January 2019)
- Krell Waterfowl Production Area Google Maps (accessed 30 January 2019)
- Lutz Waterfowl Production Area Google Maps (accessed 30 January 2019)
- Maine Waterfowl Production Area Google Maps (accessed 30 January 2019)
- National Waterfowl Production Area, White Lake, SD Google Maps (accessed 30 January 2019)
- Pleasant Lake State Public Shooting Area Google Maps (accessed 30 January 2019)
- Schulte Waterfowl Production Area Google Maps (accessed 30 January 2019)
- Sorenson Waterfowl Production Area Google Maps (accessed 30 January 2019)
- Wilmarth Lake Game Production Area, Wessington Springs, SD Google Maps (accessed 30 January 2019)
- "Annual Estimates of the Resident Population for Counties: April 1, 2010 to July 1, 2019". Retrieved April 10, 2020.
- "US Decennial Census". US Census Bureau. Retrieved March 22, 2015.
- "Historical Census Browser". University of Virginia Library. Retrieved March 22, 2015.
- Forstall, Richard L., ed. (March 27, 1995). "Population of Counties by Decennial Census: 1900 to 1990". US Census Bureau. Retrieved March 22, 2015.
- "Census 2000 PHC-T-4. Ranking Tables for Counties: 1990 and 2000" (PDF). US Census Bureau. April 2, 2001. Retrieved March 22, 2015.
- "U.S. Census website". US Census Bureau. Retrieved May 14, 2011.
- "Profile of General Population and Housing Characteristics: 2010 Demographic Profile Data". US Census Bureau. Archived from the original on 13 February 2020. Retrieved 11 March 2016.
- "Population, Housing Units, Area, and Density: 2010 - County". US Census Bureau. Archived from the original on 13 February 2020. Retrieved 11 March 2016.
- "Selected Social Characteristics in the US – 2006-2010 American Community Survey 5-Year Estimates". US Census Bureau. Archived from the original on 13 February 2020. Retrieved 11 March 2016.
- "Selected Economic Characteristic – 2006-2010 American Community Survey 5-Year Estimates". US Census Bureau. Archived from the original on 13 February 2020. Retrieved 11 March 2016.
- Leip, David. "Atlas of US Presidential Elections". uselectionatlas.org. Retrieved 13 April 2018.
Places adjacent to Aurora County, South Dakota | ||||||||||
|---|---|---|---|---|---|---|---|---|---|---|
| ||||||||||
Municipalities and communities of Aurora County, South Dakota, United States | ||
|---|---|---|
| Cities | | |
| Town | ||
| Townships |
| |
| CDPs | ||
| ||

| Authority control |
|---|