Lake County, South Dakota
Lake County is a county in the U.S. state of South Dakota. As of the 2010 United States Census, the population was 11,200.[1] Its county seat is Madison.[2] The county was formed in 1873.[3]
Lake County | |
|---|---|
.jpg.webp) Lake County Court House | |
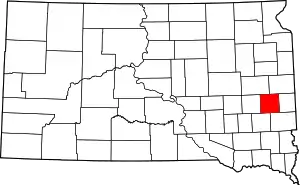 Location within the U.S. state of South Dakota | |
 South Dakota's location within the U.S. | |
| Coordinates: 44°01′N 97°07′W | |
| Country | |
| State | |
| Founded | 1873 |
| Seat | Madison |
| Largest city | Madison |
| Area | |
| • Total | 575 sq mi (1,490 km2) |
| • Land | 563 sq mi (1,460 km2) |
| • Water | 12 sq mi (30 km2) 2.1% |
| Population (2010) | |
| • Total | 11,200 |
| • Estimate (2018) | 13,057 |
| • Density | 19/sq mi (7.5/km2) |
| Time zone | UTC−6 (Central) |
| • Summer (DST) | UTC−5 (CDT) |
| Congressional district | At-large |
| Website | www |
Geography
The terrain of Lake County consists of rolling hills, with the area devoted to agriculture. A tributary of the East Fork Vermillion River flows south-southeastward through the lower western part of the county, and Buffalo Creek flows southeastward from the central part of the county, leaving the county near its southeast corner.[4] The terrain generally slopes to the south, although high points (ca. 1,814' ASL) are found on the north and south boundary lines and points between.[5]
Lake County has a total area of 575 square miles (1,490 km2), of which 563 square miles (1,460 km2) is land and 12 square miles (31 km2) (2.1%) is water.[6]
Lakes[4]
- Buffalo Slough
- Brant Lake
- Davis Slough
- Gilman Lake
- Green Lake
- Lake Badus
- Lake Herman
- Lake Madison
- Long Lake
- Mud Lake
- Pelican Lake
- Round Lake
- Spring Lake
Protected areas[4]
- Lake Herman State Park
- Walker's Point State Recreation Area
Major highways
 U.S. Highway 81
 South Dakota Highway 19
 South Dakota Highway 34
Adjacent counties
- Brookings County - northeast
- Moody County - east
- Minnehaha County - southeast
- McCook County - southwest
- Miner County - west
- Kingsbury County - northwest
Demographics
| Historical population | |||
|---|---|---|---|
| Census | Pop. | %± | |
| 1880 | 2,657 | — | |
| 1890 | 7,508 | 182.6% | |
| 1900 | 9,137 | 21.7% | |
| 1910 | 10,711 | 17.2% | |
| 1920 | 12,257 | 14.4% | |
| 1930 | 12,379 | 1.0% | |
| 1940 | 12,412 | 0.3% | |
| 1950 | 11,792 | −5.0% | |
| 1960 | 11,764 | −0.2% | |
| 1970 | 11,456 | −2.6% | |
| 1980 | 10,724 | −6.4% | |
| 1990 | 10,550 | −1.6% | |
| 2000 | 11,276 | 6.9% | |
| 2010 | 11,200 | −0.7% | |
| 2019 (est.) | 12,797 | [7] | 14.3% |
| US Decennial Census[8] 1790-1960[9] 1900-1990[10] 1990-2000[11] 2010-2018[1] | |||
2000 census
As of the 2000 United States Census,[12] there were 11,276 people, 4,372 households, and 2,828 families in the county. The population density was 20 people per square mile (8/km2). There were 5,282 housing units at an average density of 9 per square mile (4/km2). The racial makeup of the county was 97.76% White, 0.20% Black or African American, 0.66% Native American, 0.54% Asian, 0.01% Pacific Islander, 0.33% from other races, and 0.51% from two or more races. 0.79% of the population were Hispanic or Latino of any race.
There were 4,372 households, out of which 29.80% had children under the age of 18 living with them, 55.90% were married couples living together, 5.90% had a female householder with no husband present, and 35.30% were non-families. 29.20% of all households were made up of individuals, and 13.30% had someone living alone who was 65 years of age or older. The average household size was 2.41 and the average family size was 3.00.
The county population contained 23.70% under the age of 18, 15.00% from 18 to 24, 23.40% from 25 to 44, 21.40% from 45 to 64, and 16.30% who were 65 years of age or older. The median age was 36 years. For every 100 females there were 99.80 males. For every 100 females age 18 and over, there were 99.50 males.
The median income for a household in the county was $34,087, and the median income for a family was $43,750. Males had a median income of $28,994 versus $21,084 for females. The per capita income for the county was $16,446. About 5.40% of families and 9.70% of the population were below the poverty line, including 8.60% of those under age 18 and 8.60% of those age 65 or over.
2010 census
As of the 2010 United States Census, there were 11,200 people, 4,483 households, and 2,814 families in the county.[13] The population density was 19.9 inhabitants per square mile (7.7/km2). There were 5,559 housing units at an average density of 9.9 per square mile (3.8/km2).[14] The racial makeup of the county was 96.2% white, 0.7% Asian, 0.7% American Indian, 0.5% black or African American, 0.8% from other races, and 1.1% from two or more races. Those of Hispanic or Latino origin made up 1.6% of the population.[13] In terms of ancestry, 50.7% were German, 20.6% were Norwegian, 12.4% were Irish, 6.6% were English, 6.2% were Dutch, 5.0% were Danish, and 5.0% were American.[15]
Of the 4,483 households, 26.7% had children under the age of 18 living with them, 53.0% were married couples living together, 6.8% had a female householder with no husband present, 37.2% were non-families, and 30.9% of all households were made up of individuals. The average household size was 2.30 and the average family size was 2.88. The median age was 39.9 years.[13]
The median income for a household in the county was $45,606 and the median income for a family was $57,753. Males had a median income of $36,370 versus $25,898 for females. The per capita income for the county was $22,447. About 6.5% of families and 12.1% of the population were below the poverty line, including 12.8% of those under age 18 and 8.8% of those age 65 or over.[16]
Communities
City
- Madison (county seat)
Towns
Village
Census-designated places
Townships
- Badus
- Chester
- Clarno
- Concord
- Farmington
- Franklin
- Herman
- Lake View
- Le Roy
- Nunda
- Orland
- Rutland
- Summit
- Wayne
- Wentworth
- Winfred
Historical townsite
- Saranac[17]
Politics
Lake County voters have voted for Republican Party candidates in 62 percent of national elections since 1964.
| Year | Republican | Democratic | Third parties |
|---|---|---|---|
| 2020 | 62.7% 3,681 | 35.2% 2,068 | 2.1% 124 |
| 2016 | 59.5% 4,038 | 34.1% 2,314 | 6.4% 434 |
| 2012 | 54.4% 3,419 | 43.3% 2,724 | 2.3% 142 |
| 2008 | 48.6% 2,993 | 49.3% 3,033 | 2.1% 131 |
| 2004 | 55.9% 3,359 | 41.8% 2,509 | 2.3% 139 |
| 2000 | 52.9% 2,724 | 45.2% 2,331 | 1.9% 99 |
| 1996 | 38.4% 1,966 | 49.4% 2,526 | 12.2% 626 |
| 1992 | 33.8% 1,890 | 42.7% 2,388 | 23.5% 1,312 |
| 1988 | 47.6% 2,439 | 52.0% 2,663 | 0.4% 20 |
| 1984 | 55.9% 3,027 | 43.7% 2,367 | 0.4% 19 |
| 1980 | 52.9% 3,093 | 37.7% 2,207 | 9.4% 552 |
| 1976 | 46.2% 2,530 | 53.5% 2,930 | 0.3% 16 |
| 1972 | 50.1% 2,919 | 49.6% 2,886 | 0.3% 17 |
| 1968 | 53.7% 2,876 | 42.8% 2,294 | 3.5% 188 |
| 1964 | 44.7% 2,417 | 55.3% 2,988 | |
| 1960 | 61.3% 3,520 | 38.7% 2,224 | |
| 1956 | 62.3% 3,404 | 37.7% 2,058 | |
| 1952 | 73.3% 4,020 | 26.7% 1,466 | |
| 1948 | 57.0% 2,837 | 42.0% 2,093 | 1.0% 52 |
| 1944 | 65.7% 2,956 | 34.3% 1,543 | |
| 1940 | 68.9% 4,179 | 31.1% 1,889 | |
| 1936 | 53.0% 3,182 | 41.9% 2,520 | 5.1% 307 |
| 1932 | 41.1% 2,222 | 57.2% 3,090 | 1.8% 95 |
| 1928 | 63.4% 3,048 | 36.3% 1,744 | 0.3% 15 |
| 1924 | 45.4% 1,888 | 7.1% 297 | 47.5% 1,978 |
| 1920 | 70.0% 2,333 | 11.9% 398 | 18.1% 603 |
| 1916 | 55.0% 1,398 | 40.4% 1,027 | 4.5% 115 |
| 1912 | 0.0% 0 | 33.5% 657 | 66.5% 1,304 |
| 1908 | 65.6% 1,415 | 29.5% 636 | 4.9% 106 |
| 1904 | 78.9% 1,728 | 11.9% 260 | 9.2% 202 |
| 1900 | 55.6% 1,172 | 42.7% 901 | 1.7% 36 |
| 1896 | 46.1% 864 | 53.3% 999 | 0.6% 11 |
| 1892 | 43.5% 742 | 11.5% 196 | 45.1% 769 |
References
- "State & County QuickFacts". United States Census Bureau. Archived from the original on June 7, 2011. Retrieved November 25, 2013.
- "Find a County". National Association of Counties. Retrieved June 7, 2011.
- "Dakota Territory, South Dakota, and North Dakota: Individual County Chronologies". Dakota Territory Atlas of Historical County Boundaries. The Newberry Library. 2006. Retrieved March 30, 2015.
- Lake County SD Google Maps (accessed February 5, 2019)
- ""Find an Altitude" Google Maps (accessed February 5, 2019)". Archived from the original on May 21, 2019. Retrieved February 5, 2019.
- "2010 Census Gazetteer Files". US Census Bureau. August 22, 2012. Retrieved March 28, 2015.
- "Annual Estimates of the Resident Population for Counties: April 1, 2010 to July 1, 2019". Retrieved April 10, 2020.
- "US Decennial Census". US Census Bureau. Retrieved March 28, 2015.
- "Historical Census Browser". University of Virginia Library. Retrieved March 28, 2015.
- Forstall, Richard L., ed. (March 27, 1995). "Population of Counties by Decennial Census: 1900 to 1990". US Census Bureau. Retrieved March 28, 2015.
- "Census 2000 PHC-T-4. Ranking Tables for Counties: 1990 and 2000" (PDF). US Census Bureau. April 2, 2001. Retrieved March 28, 2015.
- "U.S. Census website". US Census Bureau. Retrieved May 14, 2011.
- "Profile of General Population and Housing Characteristics: 2010 Demographic Profile Data". US Census Bureau. Archived from the original on February 13, 2020. Retrieved March 12, 2016.
- "Population, Housing Units, Area, and Density: 2010 - County". US Census Bureau. Archived from the original on February 13, 2020. Retrieved March 12, 2016.
- "Selected Social Characteristics in the US – 2006-2010 American Community Survey 5-Year Estimates". US Census Bureau. Archived from the original on February 13, 2020. Retrieved March 12, 2016.
- "Selected Economic Characteristics – 2006-2010 American Community Survey 5-Year Estimates". US Census Bureau. Archived from the original on February 13, 2020. Retrieved March 12, 2016.
- Saranac (historical) in Lake County SD SD Home Town Locator (accessed 5 February 2019)
- Leip, David. "Atlas of US Presidential Elections". uselectionatlas.org. Retrieved April 15, 2018.
External links
Places adjacent to Lake County, South Dakota | ||||||||||
|---|---|---|---|---|---|---|---|---|---|---|
| ||||||||||
Municipalities and communities of Lake County, South Dakota, United States | ||
|---|---|---|
| City | | |
| Towns | ||
| Village | ||
| CDPs | ||
| Other unincorporated communities | ||
| ||

| Authority control |
|---|