Marshall County, South Dakota
Marshall County is a county in the U.S. state of South Dakota. As of the 2010 census, the population was 4,656.[1] Its county seat is Britton.[2] The county was created on May 2, 1885,[3] and was named for Marshall Vincent, who homesteaded near Andover, South Dakota.[4]
Marshall County | |
|---|---|
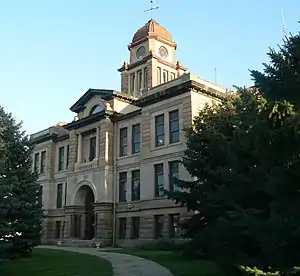 Marshall County Courthouse in Britton | |
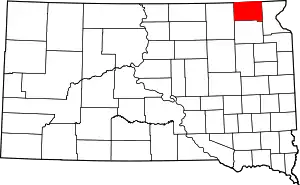 Location within the U.S. state of South Dakota | |
 South Dakota's location within the U.S. | |
| Coordinates: 45°46′N 97°36′W | |
| Country | |
| State | |
| Founded | 1885 |
| Named for | Marshall Vincent |
| Seat | Britton |
| Largest city | Britton |
| Area | |
| • Total | 886 sq mi (2,290 km2) |
| • Land | 838 sq mi (2,170 km2) |
| • Water | 48 sq mi (120 km2) 5.4% |
| Population (2010) | |
| • Total | 4,656 |
| • Estimate (2018) | 5,112 |
| • Density | 5.3/sq mi (2.0/km2) |
| Time zone | UTC−6 (Central) |
| • Summer (DST) | UTC−5 (CDT) |
| Congressional district | At-large |
| Website | marshall |
Geography
Marshall County lies on the north side of South Dakota. Its north boundary line abuts the south boundary line of the state of North Dakota. Its terrain consists of rolling hills, with numerous lakes and ponds in the SE portion.[5] Its terrain slopes to the northeast, and its highest point is near its SE corner, at 2,034' (620m) ASL.[6]
Marshall County has a total area of 886 square miles (2,290 km2), of which 838 square miles (2,170 km2) is land and 48 square miles (120 km2) (5.4%) is water.[7] The county is drained by the Crow Creek, a tributary of the James River, and the Wild Rice River, a tributary of the Red River of the North.[8] A portion of the Lake Traverse Indian Reservation is located in the eastern part of the county.
Protected areas
- Abraham State Game Production Area
- Aspen Slough State Game Production Area
- Black Slough State Game Production Area
- Bonham State Game Production Area
- Buffalo Lakes State Game Production Area
- Bullhead State Lakeside Use Area
- Cattail State Game Production Area
- Church State Game Production Area
- Clear Lake State Game Production Area
- Clear Lake State Lakeside Use Area
- Douglas State Game Production Area
- Eden State Game Production Area
- Flat Creek State Game Production Area
- Fort Sisseton Historic State Park
- Fort Sisseton State Game Production Area
- Four Mile-Clubhouse-Barretts State Game Production Area
- Four Mile State Lakeside Use Area
- Hamilton Township State Game Production Area
- Hickman Dam State Game Production Area
- Horeshoe State Game Production Area
- Ivory Tower State Game Production Area
- Knebel State Game Production Area (part)
- Little Cottonwood State Game Production Area
- Lost Lake State Game Production Area
- Nine Mile State Game Production Area
- North Church State Game Production Area
- North Ottertail State Game Production Area
- North Red Iron State Game Production Area
- Renziehausen State Game Production Area (part)
- Rock Crandall State Game Production Area
- Roy Lake State Game Production Area
- Roy Lake State Park
- Schlosser Memorial State Game Production Area
- Sica Hollow State Park (part)
- Sorbell State Game Production Area
- South Red Iron State Game Production Area
- Turtlefoot State Game Production Area
- White Lake State Game Production Area
Adjacent counties
- Sargent County, North Dakota - north
- Richland County, North Dakota - northeast
- Roberts County - east
- Day County - south
- Brown County - west
Demographics
| Historical population | |||
|---|---|---|---|
| Census | Pop. | %± | |
| 1890 | 4,544 | — | |
| 1900 | 5,942 | 30.8% | |
| 1910 | 8,021 | 35.0% | |
| 1920 | 9,596 | 19.6% | |
| 1930 | 9,540 | −0.6% | |
| 1940 | 8,880 | −6.9% | |
| 1950 | 7,835 | −11.8% | |
| 1960 | 6,663 | −15.0% | |
| 1970 | 5,965 | −10.5% | |
| 1980 | 5,404 | −9.4% | |
| 1990 | 4,844 | −10.4% | |
| 2000 | 4,576 | −5.5% | |
| 2010 | 4,656 | 1.7% | |
| 2019 (est.) | 4,935 | [9] | 6.0% |
| US Decennial Census[10] 1790-1960[11] 1900-1990[12] 1990-2000[13] 2010-2018[1] | |||
2000 census
As of the 2000 United States Census,[14] there were 4,576 people, 1,844 households, and 1,252 families in the county. The population density was 6 people per square mile (2/km2). There were 2,562 housing units at an average density of 3 per square mile (1/km2). The racial makeup of the county was 92.59% White, 0.09% Black or African American, 6.32% Native American, 0.09% Asian, 0.22% from other races, and 0.70% from two or more races. 0.76% of the population were Hispanic or Latino of any race.
There were 1,844 households, out of which 29.80% had children under the age of 18 living with them, 57.20% were married couples living together, 6.50% had a female householder with no husband present, and 32.10% were non-families. 30.10% of all households were made up of individuals, and 16.10% had someone living alone who was 65 years of age or older. The average household size was 2.43 and the average family size was 3.04.
The county population contained 27.00% under the age of 18, 5.10% from 18 to 24, 22.80% from 25 to 44, 23.80% from 45 to 64, and 21.30% who were 65 years of age or older. The median age was 42 years. For every 100 females there were 100.00 males. For every 100 females age 18 and over, there were 96.80 males.
The median income for a household in the county was $30,567, and the median income for a family was $36,295. Males had a median income of $27,241 versus $17,872 for females. The per capita income for the county was $15,462. About 10.40% of families and 13.90% of the population were below the poverty line, including 19.00% of those under age 18 and 14.00% of those age 65 or over.
2010 census
As of the 2010 United States Census, there were 4,656 people, 1,815 households, and 1,154 families in the county.[15] The population density was 5.6 inhabitants per square mile (2.2/km2). There were 2,534 housing units at an average density of 3.0 per square mile (1.2/km2).[16] The racial makeup of the county was 85.4% white, 7.6% American Indian, 0.2% black or African American, 0.2% Asian, 5.6% from other races, and 1.1% from two or more races. Those of Hispanic or Latino origin made up 6.8% of the population.[15] In terms of ancestry, 45.6% were German, 30.6% were Norwegian, 6.8% were Swedish, 5.8% were Irish, 5.2% were English, and 2.7% were American.[17]
Of the 1,815 households, 24.4% had children under the age of 18 living with them, 52.8% were married couples living together, 6.0% had a female householder with no husband present, 36.4% were non-families, and 31.4% of all households were made up of individuals. The average household size was 2.36 and the average family size was 2.83. The median age was 43.2 years.[15]
The median income for a household in the county was $41,023 and the median income for a family was $56,544. Males had a median income of $31,639 versus $26,737 for females. The per capita income for the county was $22,441. About 9.3% of families and 17.1% of the population were below the poverty line, including 27.6% of those under age 18 and 12.8% of those age 65 or over.[18]
Communities
Census-designated place
Townships
- Buffalo
- Dayton
- Dumarce
- Eden
- Fort
- Hamilton
- Hickman
- La Belle
- Lake
- Lowell
- McKinley
- Miller
- Newark
- Newport
- Nordland
- Pleasant Valley
- Red Iron Lake
- Sisseton
- Stena
- Veblen
- Victor
- Waverly
- Weston
- White
- Wismer
Politics
Marshall County voters have tended to vote Democratic for the past several decades. In 64% of the national elections since 1960, the county selected the Democratic Party candidate.
| Year | Republican | Democratic | Third Parties |
|---|---|---|---|
| 2016 | 54.2% 1,056 | 38.7% 754 | 7.0% 137 |
| 2012 | 44.7% 889 | 53.4% 1,061 | 1.9% 37 |
| 2008 | 41.1% 900 | 57.6% 1,261 | 1.4% 30 |
| 2004 | 52.5% 1,242 | 46.5% 1,099 | 1.0% 23 |
| 2000 | 52.8% 1,097 | 45.2% 939 | 2.1% 43 |
| 1996 | 38.3% 861 | 52.8% 1,185 | 8.9% 200 |
| 1992 | 35.3% 810 | 46.0% 1,056 | 18.8% 431 |
| 1988 | 45.2% 1,142 | 54.3% 1,372 | 0.4% 11 |
| 1984 | 57.7% 1,529 | 41.9% 1,111 | 0.3% 9 |
| 1980 | 57.0% 1,710 | 37.3% 1,120 | 5.7% 171 |
| 1976 | 41.6% 1,233 | 58.0% 1,721 | 0.4% 13 |
| 1972 | 47.7% 1,500 | 52.3% 1,646 | 0.0% 1 |
| 1968 | 47.0% 1,471 | 48.5% 1,518 | 4.5% 140 |
| 1964 | 36.4% 1,183 | 63.6% 2,063 | |
| 1960 | 50.4% 1,704 | 49.6% 1,674 | |
| 1956 | 57.5% 2,382 | 42.5% 1,758 | |
| 1952 | 66.5% 2,248 | 33.6% 1,135 | |
| 1948 | 44.4% 1,419 | 53.5% 1,710 | 2.2% 69 |
| 1944 | 52.6% 1,511 | 47.4% 1,363 | |
| 1940 | 50.2% 1,989 | 49.8% 1,972 | |
| 1936 | 32.6% 1,105 | 65.5% 2,220 | 1.8% 62 |
| 1932 | 27.1% 935 | 62.0% 2,137 | 10.9% 374 |
| 1928 | 57.1% 1,858 | 40.4% 1,315 | 2.4% 79 |
| 1924 | 51.5% 1,271 | 7.7% 190 | 40.8% 1,005 |
| 1920 | 56.0% 1,557 | 9.6% 266 | 34.5% 959 |
| 1916 | 45.6% 808 | 49.9% 885 | 4.5% 80 |
| 1912 | 0.0% 0 | 43.1% 541 | 56.9% 715 |
| 1908 | 59.5% 874 | 30.8% 453 | 9.7% 143 |
| 1904 | 67.9% 996 | 19.9% 292 | 12.1% 178 |
| 1900 | 51.9% 829 | 45.6% 728 | 2.4% 39 |
| 1896 | 43.8% 553 | 55.0% 694 | 1.3% 16 |
| 1892 | 44.0% 477 | 10.5% 114 | 45.5% 494 |
External links
References
- "State & County QuickFacts". United States Census Bureau. Archived from the original on June 7, 2011. Retrieved November 25, 2013.
- "Find a County". National Association of Counties. Retrieved June 7, 2013.
- Individual County Chronologies/Marshall County (accessed February 6, 2019)
- Legislative Manual, South Dakota, 2005, p. 596
- Marshall County SD Google Maps (accessed 6 February 2019)
- ""Find an Altitude" Google Maps (accessed 6 February 2019)". Archived from the original on May 21, 2019. Retrieved February 6, 2019.
- "2010 Census Gazetteer Files". US Census Bureau. August 22, 2012. Retrieved March 28, 2015.
- Koopman, F. C. (1957). "Ground water in the Crow Creek-Sand Lake area, Brown and Marshall Counties, South Dakota " United States Geological Survey Water Supply Paper Series number:1425. Washington, DC: Government Printing Office. USGS website Retrieved November 18, 2017
- "Annual Estimates of the Resident Population for Counties: April 1, 2010 to July 1, 2019". Retrieved April 10, 2020.
- "US Decennial Census". US Census Bureau. Retrieved March 28, 2015.
- "Historical Census Browser". University of Virginia Library. Retrieved March 28, 2015.
- Forstall, Richard L., ed. (March 27, 1995). "Population of Counties by Decennial Census: 1900 to 1990". US Census Bureau. Retrieved March 28, 2015.
- "Census 2000 PHC-T-4. Ranking Tables for Counties: 1990 and 2000" (PDF). US Census Bureau. April 2, 2001. Retrieved March 28, 2015.
- "U.S. Census website". US Census Bureau. Retrieved May 14, 2011.
- "Profile of General Population and Housing Characteristics: 2010 Demographic Profile Data". US Census Bureau. Archived from the original on February 13, 2020. Retrieved March 12, 2016.
- "Population, Housing Units, Area, and Density: 2010 - County". US Census Bureau. Archived from the original on February 13, 2020. Retrieved March 12, 2016.
- "Selected Social Characteristics in the US – 2006-2010 American Community Survey 5-Year Estimates". US Census Bureau. Archived from the original on February 13, 2020. Retrieved March 12, 2016.
- "Selected Economic Characteristics – 2006-2010 American Community Survey 5-Year Estimates". US Census Bureau. Archived from the original on February 13, 2020. Retrieved March 12, 2016.
- Election Results
Places adjacent to Marshall County, South Dakota | ||||||||||
|---|---|---|---|---|---|---|---|---|---|---|
| ||||||||||
Municipalities and communities of Marshall County, South Dakota, United States | ||
|---|---|---|
| Cities | | |
| Towns | ||
| CDP | ||
| Unincorporated communities | ||
| Indian reservation | ||
| Footnotes | ‡This populated place also has portions in an adjacent county or counties | |
| ||
