Kingsbury County, South Dakota
Kingsbury County is a county in the U.S. state of South Dakota. As of the 2010 census, the population was 5,148.[1] Its county seat is De Smet.[2] The county was created in 1873, and was organized in 1880.[3] It was named for brothers George W. and T. A. Kingsbury, descendants of the colonial English Kingsbury family in Boston, Massachusetts. They were prominently involved in the affairs of Dakota Territory and served as elected members of several Territorial Legislatures.
Kingsbury County | |
|---|---|
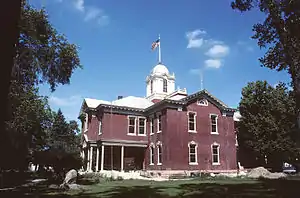 Kingsbury County Courthouse in De Smet | |
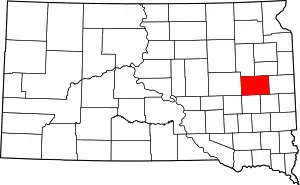 Location within the U.S. state of South Dakota | |
 South Dakota's location within the U.S. | |
| Coordinates: 44°22′N 97°29′W | |
| Country | |
| State | |
| Founded | 1873 (created) 1880 (organized) |
| Named for | George W. Kingsbury & T.A. Kingsbury |
| Seat | De Smet |
| Largest city | De Smet |
| Area | |
| • Total | 864 sq mi (2,240 km2) |
| • Land | 832 sq mi (2,150 km2) |
| • Water | 32 sq mi (80 km2) 3.6% |
| Population (2010) | |
| • Total | 5,148 |
| • Estimate (2018) | 4,919 |
| • Density | 6.0/sq mi (2.3/km2) |
| Time zone | UTC−6 (Central) |
| • Summer (DST) | UTC−5 (CDT) |
| Congressional district | At-large |
| Website | kingsbury |
Geography
The terrain of Kingsbury County consists of low rolling hills. The central and east portions of the county hold numerous lakes and ponds. The land is largely devoted to agriculture.[4] The terrain generally slopes to the southwest, and the highest point is near the midpoint of the east boundary line, at 1,857' (566m) ASL.[5] The county has a total area of 864 square miles (2,240 km2), of which 832 square miles (2,150 km2) is land and 3.6 square miles (9.3 km2) (6.2%) is water.[6]
Lakes[4]
- Cherry Lake
- Mud Lake
- Lake Albert
- Lake Badger
- Lake Henry
- Lake Iroquois
- Lake Preston
- Lake Thisted
- Lake Thompson
- Lake Whitewood
- Osceola Lake
- Plum Lake
- Spring Lake
- Spirit Lake
- Twin Lakes (partial)
Major highways
 U.S. Highway 14
 U.S. Highway 81
 South Dakota Highway 25
Adjacent counties
- Hamlin County – northeast
- Brookings County – east
- Lake County – southeast
- Miner County – south
- Sanborn County – southwest
- Beadle County – west
- Clark County – northwest
Protected areas[4]
- Arnold State Public Shooting Area
Demographics
Industrialization of agriculture and the attraction of urban areas have contributed to the decline in population of Kingsbury County, similar to what has occurred in other Plains rural areas. In 2010 it had less than half the population of its peak in 1930, before the Dust Bowl and the Great Depression.
| Historical population | |||
|---|---|---|---|
| Census | Pop. | %± | |
| 1880 | 1,102 | — | |
| 1890 | 8,562 | 677.0% | |
| 1900 | 9,866 | 15.2% | |
| 1910 | 12,560 | 27.3% | |
| 1920 | 12,802 | 1.9% | |
| 1930 | 12,805 | 0.0% | |
| 1940 | 10,831 | −15.4% | |
| 1950 | 9,962 | −8.0% | |
| 1960 | 9,227 | −7.4% | |
| 1970 | 7,657 | −17.0% | |
| 1980 | 6,679 | −12.8% | |
| 1990 | 5,925 | −11.3% | |
| 2000 | 5,815 | −1.9% | |
| 2010 | 5,148 | −11.5% | |
| 2019 (est.) | 4,939 | [7] | −4.1% |
| US Decennial Census[8] 1790-1960[9] 1900-1990[10] 1990-2000[11] 2010-2018[1] | |||
2000 census
As of the 2000 United States Census,[12] there were 5,815 people, 2,406 households, and 1,592 families in the county. The population density was 7 people per square mile (3/km2). There were 2,724 housing units at an average density of 3 per square mile (1/km2). The racial makeup of the county was 98.54% White, 0.05% Black or African American, 0.40% Native American, 0.29% Asian, 0.19% from other races, and 0.53% from two or more races. 0.69% of the population were Hispanic or Latino of any race. 36.2% were of German, 22.5% Norwegian, 8.4% Danish, 7.0% American and 5.9% Irish ancestry.
There were 2,406 households, out of which 27.90% had children under the age of 18 living with them, 59.00% were married couples living together, 4.40% had a female householder with no husband present, and 33.80% were non-families. 31.50% of all households were made up of individuals, and 17.80% had someone living alone who was 65 years of age or older. The average household size was 2.34 and the average family size was 2.95.
The county population contained 24.50% under the age of 18, 6.10% from 18 to 24, 22.90% from 25 to 44, 22.40% from 45 to 64, and 24.20% who were 65 years of age or older. The median age was 43 years. For every 100 females there were 96.30 males. For every 100 females age 18 and over, there were 95.90 males.
The median income for a household in the county was $31,262, and the median income for a family was $41,057. Males had a median income of $26,681 versus $19,174 for females. The per capita income for the county was $16,522. About 7.00% of families and 10.00% of the population were below the poverty line, including 13.50% of those under age 18 and 11.10% of those age 65 or over.
2010 census
As of the 2010 United States Census, there were 5,148 people, 2,222 households, and 1,418 families in the county.[13] The population density was 6.2 inhabitants per square mile (2.4/km2). There were 2,720 housing units at an average density of 3.3 per square mile (1.3/km2).[14] The racial makeup of the county was 98.1% white, 0.5% American Indian, 0.3% Asian, 0.1% black or African American, 0.3% from other races, and 0.8% from two or more races. Those of Hispanic or Latino origin made up 1.4% of the population.[13] In terms of European ancestry, 42.8% were German, 25.5% were Norwegian, 10.9% were Danish, 9.6% were Irish, 7.2% were English, and 3.5% were American.[15]
Of the 2,222 households, 24.3% had children under the age of 18 living with them, 55.6% were married couples living together, 5.0% had a female householder with no husband present, 36.2% were non-families, and 32.2% of all households were made up of individuals. The average household size was 2.23 and the average family size was 2.81. The median age was 47.1 years.[13]
The median income for a household in the county was $44,948 and the median income for a family was $56,925. Males had a median income of $35,585 versus $28,141 for females. The per capita income for the county was $24,660. About 7.0% of families and 9.2% of the population were below the poverty line, including 8.8% of those under age 18 and 10.8% of those age 65 or over.[16]
Communities
Cities
- De Smet (county seat)
- Arlington (partial)
- Iroquois (partial)
- Lake Preston
- Oldham
Ghost town
Townships
- Badger
- Baker
- De Smet
- Denver
- Esmond
- Hartland
- Iroquois
- Le Sueur
- Manchester
- Mathews
- Spirit Lake
- Spring Lake
- Whitewood
Notable people
- Harvey Dunn - painter and professor of Fine Arts
- Laura Ingalls Wilder - author
Politics
Kingsbury County voters have been reliably Republican for decades. In only two national elections since 1932 has the county selected the Democratic Party candidate (as of 2016).
| Year | Republican | Democratic | Third parties |
|---|---|---|---|
| 2016 | 65.9% 1,680 | 27.6% 703 | 6.6% 168 |
| 2012 | 55.6% 1,451 | 41.9% 1,092 | 2.5% 65 |
| 2008 | 51.5% 1,435 | 45.9% 1,277 | 2.6% 72 |
| 2004 | 59.9% 1,804 | 38.6% 1,163 | 1.6% 47 |
| 2000 | 59.1% 1,612 | 38.5% 1,049 | 2.4% 66 |
| 1996 | 43.2% 1,297 | 45.2% 1,357 | 11.6% 347 |
| 1992 | 35.4% 1,113 | 40.3% 1,267 | 24.3% 763 |
| 1988 | 51.6% 1,592 | 47.7% 1,472 | 0.8% 23 |
| 1984 | 62.7% 2,121 | 36.9% 1,249 | 0.4% 13 |
| 1980 | 62.4% 2,376 | 29.7% 1,132 | 7.9% 299 |
| 1976 | 51.0% 1,844 | 48.7% 1,762 | 0.3% 11 |
| 1972 | 58.6% 2,320 | 41.2% 1,632 | 0.2% 6 |
| 1968 | 58.4% 2,300 | 37.9% 1,491 | 3.7% 146 |
| 1964 | 51.5% 2,126 | 48.5% 2,005 | |
| 1960 | 63.3% 2,887 | 36.7% 1,677 | |
| 1956 | 64.9% 2,933 | 35.1% 1,585 | |
| 1952 | 78.3% 3,703 | 21.8% 1,029 | |
| 1948 | 62.6% 2,332 | 35.9% 1,338 | 1.6% 58 |
| 1944 | 68.7% 2,541 | 31.3% 1,156 | |
| 1940 | 70.3% 3,551 | 29.7% 1,503 | |
| 1936 | 55.4% 2,813 | 40.1% 2,037 | 4.5% 226 |
| 1932 | 42.4% 2,135 | 55.8% 2,808 | 1.8% 90 |
| 1928 | 71.9% 3,499 | 27.8% 1,352 | 0.4% 17 |
| 1924 | 65.7% 2,242 | 9.8% 333 | 24.6% 840 |
| 1920 | 71.7% 2,344 | 14.7% 481 | 13.6% 446 |
| 1916 | 51.8% 1,339 | 42.4% 1,096 | 5.8% 150 |
| 1912 | 0.0% 0 | 34.5% 747 | 65.5% 1,417 |
| 1908 | 60.7% 1,537 | 31.6% 799 | 7.7% 196 |
| 1904 | 77.7% 1,896 | 14.1% 344 | 8.2% 201 |
| 1900 | 58.1% 1,330 | 37.9% 868 | 4.0% 91 |
| 1896 | 46.8% 950 | 51.8% 1,051 | 1.4% 28 |
| 1892 | 46.3% 951 | 8.5% 175 | 45.2% 929 |
References
- "State & County QuickFacts". United States Census Bureau. Archived from the original on June 7, 2011. Retrieved November 25, 2013.
- "Find a County". National Association of Counties. Archived from the original on May 31, 2011. Retrieved June 7, 2011.
- "Dakota Territory, South Dakota, and North Dakota: Individual County Chronologies". Dakota Territory Atlas of Historical County Boundaries. The Newberry Library. 2006. Retrieved March 30, 2015.
- Kingsbury County SD Google Maps (accessed 5 February 2019)
- ""Find an Altitude" Google Maps (accessed 5 February 2019)". Archived from the original on May 21, 2019. Retrieved February 5, 2019.
- "2010 Census Gazetteer Files". US Census Bureau. August 22, 2012. Retrieved March 26, 2015.
- "Annual Estimates of the Resident Population for Counties: April 1, 2010 to July 1, 2019". Retrieved April 10, 2020.
- "US Decennial Census". US Census Bureau. Retrieved March 26, 2015.
- "Historical Census Browser". University of Virginia Library. Retrieved March 26, 2015.
- Forstall, Richard L., ed. (March 27, 1995). "Population of Counties by Decennial Census: 1900 to 1990". US Census Bureau. Retrieved March 26, 2015.
- "Census 2000 PHC-T-4. Ranking Tables for Counties: 1990 and 2000" (PDF). US Census Bureau. April 2, 2001. Retrieved March 26, 2015.
- "U.S. Census website". US Census Bureau. Retrieved May 14, 2011.
- "Profile of General Population and Housing Characteristics: 2010 Demographic Profile Data". US Census Bureau. Archived from the original on February 13, 2020. Retrieved March 12, 2016.
- "Population, Housing Units, Area, and Density: 2010 - County". US Census Bureau. Archived from the original on February 13, 2020. Retrieved March 12, 2016.
- "Selected Social Characteristics in the US – 2006-2010 American Community Survey 5-Year Estimates". US Census Bureau. Archived from the original on February 13, 2020. Retrieved March 12, 2016.
- "Selected Economic Characteristics – 2006-2010 American Community Survey 5-Year Estimates". US Census Bureau. Archived from the original on February 13, 2020. Retrieved March 12, 2016.
- Leip, David. "Atlas of US Presidential Elections". uselectionatlas.org. Retrieved April 15, 2018.
External links
Further reading
- Johnson, Lyle R. "Decades of Drought: A Year by Year-by-Year Account of Weather-Related Changes in 1930s Kingsbury County," South Dakota History 43 (Fall 2013), 218–44.
Places adjacent to Kingsbury County, South Dakota | ||||||||||
|---|---|---|---|---|---|---|---|---|---|---|
| ||||||||||
Municipalities and communities of Kingsbury County, South Dakota, United States | ||
|---|---|---|
| Cities | | |
| Towns | ||
| Unincorporated communities | ||
| Ghost town | ||
| Footnotes | ‡This populated place also has portions in an adjacent county or counties | |
| ||

| Authority control |
|---|