Campbell County, South Dakota
Campbell County is a county in the U.S. state of South Dakota. As of the 2010 census, the population was 1,466,[1] making it the fifth-least populous county in South Dakota. Its county seat is Mound City.[2] The county was created in 1873 and organized in 1884.[3] It was named for Norman B. Campbell, a Dakota Territory legislator in 1873 and son of General Charles T. Campbell.[4]
Campbell County | |
|---|---|
 | |
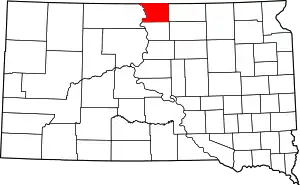 Location within the U.S. state of South Dakota | |
 South Dakota's location within the U.S. | |
| Coordinates: 45°46′N 100°03′W | |
| Country | |
| State | |
| Founded | 1873 (created) 1884 (organized) |
| Seat | Mound City |
| Largest city | Herreid |
| Area | |
| • Total | 771 sq mi (2,000 km2) |
| • Land | 734 sq mi (1,900 km2) |
| • Water | 37 sq mi (100 km2) 4.8% |
| Population (2010) | |
| • Total | 1,466 |
| • Estimate (2018) | 1,377 |
| • Density | 1.9/sq mi (0.73/km2) |
| Time zone | UTC−6 (Central) |
| • Summer (DST) | UTC−5 (CDT) |
| Congressional district | At-large |
History
Campbell County was formed in 1873 and organized in 1884. La Grace served as the first county seat; in 1888 the seat was transferred to Mound City.[5]
Geography
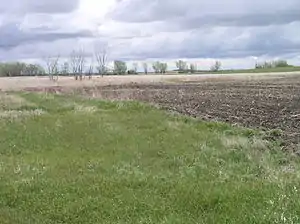
Campbell County lies on the north side of South Dakota; its north boundary line abuts the south boundary line of the state of North Dakota. The Missouri River flows southward along the county's west boundary line. The county terrain consists of semi-arid low rolling hills, a portion of which is dedicated to agriculture.[6] The terrain slopes to the south and east, with its highest point occurring on the county's north boundary line, toward the NE corner: 2,060' (628m).[7] The county has a total area of 771 square miles (2,000 km2), of which 734 square miles (1,900 km2) is land and 37 square miles (96 km2) (4.8%) is water.[8]
The eastern portion of South Dakota's counties (48 of 66) observe Central Time; the western counties (18 of 66) observe Mountain Time. Campbell County is the westernmost of the SD counties to observe Central Time.[9]
Major Highways
 U.S. Highway 83
 South Dakota Highway 10
 South Dakota Highway 271
 South Dakota Highway 1804
Adjacent Counties
- Emmons County, North Dakota - north
- McIntosh County, North Dakota - northeast
- McPherson County - east
- Walworth County - south
- Corson County - west (boundary of Mountain Time)
Protected areas
Lakes
- McClarem Lake
- Lake Oahe (part)
- Lake Pocasse
- Salt Lake
- Sand Lake
Demographics
| Historical population | |||
|---|---|---|---|
| Census | Pop. | %± | |
| 1880 | 50 | — | |
| 1890 | 3,510 | 6,920.0% | |
| 1900 | 4,527 | 29.0% | |
| 1910 | 5,244 | 15.8% | |
| 1920 | 5,305 | 1.2% | |
| 1930 | 5,629 | 6.1% | |
| 1940 | 5,033 | −10.6% | |
| 1950 | 4,046 | −19.6% | |
| 1960 | 3,531 | −12.7% | |
| 1970 | 2,866 | −18.8% | |
| 1980 | 2,243 | −21.7% | |
| 1990 | 1,965 | −12.4% | |
| 2000 | 1,782 | −9.3% | |
| 2010 | 1,466 | −17.7% | |
| 2019 (est.) | 1,376 | [16] | −6.1% |
| US Decennial Census[17] 1790-1960[18] 1900-1990[19] 1990-2000[20] 2010-2018[1] | |||
2000 census
As of the 2000 United States Census,[21] there were 1,782 people, 725 households, and 508 families in the county. The population density was 2 people per square mile (1/km2). There were 962 housing units at an average density of 1.3 per square mile (0.5/km2). The racial makeup of the county was 99.33% White, 0.34% Native American, 0.06% Asian, and 0.28% from two or more races. 0.22% of the population were Hispanic or Latino of any race. 63.1% were of German, 17.2% Norwegian and 6.4% Dutch ancestry.
There were 725 households, out of which 30.30% had children under the age of 18 living with them, 65.80% were married couples living together, 2.60% had a female householder with no husband present, and 29.90% were non-families. 28.60% of all households were made up of individuals, and 15.70% had someone living alone who was 65 years of age or older. The average household size was 2.43 and the average family size was 3.02.
The county population contained 26.40% under the age of 18, 3.50% from 18 to 24, 24.50% from 25 to 44, 23.50% from 45 to 64, and 22.10% who were 65 years of age or older. The median age was 42 years. For every 100 females there were 100.70 males. For every 100 females age 18 and over, there were 98.30 males.
The median income for a household in the county was $28,793, and the median income for a family was $35,938. Males had a median income of $22,128 versus $17,237 for females. The per capita income for the county was $14,117. About 11.20% of families and 14.10% of the population were below the poverty line, including 7.70% of those under age 18 and 22.30% of those age 65 or over.
2010 census
As of the 2010 United States Census, there were 1,466 people, 694 households, and 423 families in the county.[22] The population density was 2.0 inhabitants per square mile (0.77/km2). There were 980 housing units at an average density of 1.3 per square mile (0.50/km2).[23] The racial makeup of the county was 98.3% white, 0.3% Asian, 0.3% American Indian, 0.1% black or African American, 0.2% from other races, and 0.8% from two or more races. Those of Hispanic or Latino origin made up 1.4% of the population.[22] In terms of ancestry, 68.5% were German, 14.1% were Norwegian, 12.6% were Dutch, 11.4% were Russian, 7.8% were Irish, and 2.7% were American.[24]
Of the 694 households, 21.6% had children under the age of 18 living with them, 55.6% were married couples living together, 3.0% had a female householder with no husband present, 39.0% were non-families, and 35.6% of all households were made up of individuals. The average household size was 2.11 and the average family size was 2.70. The median age was 50.1 years.[22]
The median income for a household in the county was $42,833 and the median income for a family was $48,864. Males had a median income of $41,563 versus $30,705 for females. The per capita income for the county was $22,338. About 6.1% of families and 10.7% of the population were below the poverty line, including 20.8% of those under age 18 and 13.0% of those age 65 or over.[25]
Religion
In the 2010 census, the largest denomination was the Evangelical Lutheran Church in America with 286 adherents, followed by the Catholic church with 191 members, the third was the Presbyterian Church in America with 186 followers. The Reformed Church in the United States, the Wisconsin Evangelical Lutheran Synod, and the North American Baptist Conference were also represented with lesser numbers.[26] Campbell County has the highest percentage of Presbyterians in the United States.
Politics
With its rural German-American heritage, Campbell is an overwhelmingly Republican county. It has only once been carried by a Democratic Presidential candidate, during Franklin D. Roosevelt’s landslide victory of 1932. Nonetheless, in the following election when FDR gained a even more emphatic victory by carrying forty-six of forty-eight states, his Republican opponent Alf Landon carried Campbell County by twenty-five percentage points, making the county Landon’s second-strongest in the Plains States (behind Brown County in his home state). Since 1940, no Democrat has so much as equalled Roosevelt’s 1936 share of the vote, and even before 1932, only William Jennings Bryan in 1896 gained over forty percent of the vote for the Democratic Party. In 1952, Campbell was Dwight D. Eisenhower’s third-strongest county in the nation,[29] and in 1964 it rivalled Hooker County in Nebraska and that famous GOP bastion Jackson County in Kentucky as Barry Goldwater’s strongest county outside the South.
| Year | Republican | Democratic | Third parties |
|---|---|---|---|
| 2016 | 84.7% 704 | 12.6% 105 | 2.7% 22 |
| 2012 | 78.3% 616 | 19.4% 153 | 2.3% 18 |
| 2008 | 69.2% 591 | 28.5% 243 | 2.3% 20 |
| 2004 | 73.8% 708 | 24.9% 239 | 1.3% 12 |
| 2000 | 80.6% 739 | 16.0% 147 | 3.4% 31 |
| 1996 | 64.2% 623 | 20.8% 202 | 15.0% 145 |
| 1992 | 54.5% 574 | 21.1% 222 | 24.4% 257 |
| 1988 | 72.6% 909 | 26.7% 334 | 0.7% 9 |
| 1984 | 82.5% 1,035 | 17.1% 214 | 0.5% 6 |
| 1980 | 84.9% 1,271 | 12.2% 182 | 3.0% 45 |
| 1976 | 64.5% 897 | 35.2% 489 | 0.4% 5 |
| 1972 | 76.1% 1,169 | 23.5% 361 | 0.5% 7 |
| 1968 | 79.3% 1,216 | 16.0% 245 | 4.8% 73 |
| 1964 | 73.9% 1,162 | 26.1% 411 | |
| 1960 | 78.6% 1,330 | 21.4% 362 | |
| 1956 | 81.4% 1,268 | 18.6% 289 | |
| 1952 | 90.1% 1,536 | 9.9% 168 | |
| 1948 | 78.1% 1,518 | 21.1% 410 | 0.9% 17 |
| 1944 | 83.4% 1,047 | 16.6% 208 | |
| 1940 | 80.6% 1,733 | 19.4% 416 | |
| 1936 | 61.0% 1,236 | 36.3% 736 | 2.7% 55 |
| 1932 | 40.4% 770 | 58.6% 1,116 | 1.0% 18 |
| 1928 | 69.1% 1,346 | 30.2% 588 | 0.7% 13 |
| 1924 | 54.6% 641 | 3.9% 46 | 41.5% 488 |
| 1920 | 71.3% 1,128 | 4.2% 67 | 24.5% 388 |
| 1916 | 77.4% 644 | 19.6% 163 | 3.0% 25 |
| 1912 | 19.6% 150 | 80.4% 616 | |
| 1908 | 75.2% 627 | 21.0% 175 | 3.8% 32 |
| 1904 | 83.0% 685 | 14.6% 120 | 2.4% 20 |
| 1900 | 70.4% 626 | 28.1% 250 | 1.5% 13 |
| 1896 | 54.6% 449 | 44.9% 369 | 0.5% 4 |
| 1892 | 58.1% 390 | 11.5% 77 | 30.4% 204 |
References
- "State & County QuickFacts". United States Census Bureau. Archived from the original on July 8, 2011. Retrieved November 26, 2013.
- "Find a County". National Association of Counties. Archived from the original on May 31, 2011. Retrieved June 7, 2011.
- "Dakota Territory, South Dakota, and North Dakota: Individual County Chronologies". Dakota Territory Atlas of Historical County Boundaries. The Newberry Library. 2006. Retrieved March 29, 2015.
- Legislative Manual, South Dakota, 2005, p. 596
- Hellmann, Paul T. (May 13, 2013). Historical Gazetteer of the United States. Routledge. p. 993. ISBN 978-1135948597. Retrieved November 30, 2013.
- Campbell County SD Google Maps (accessed 31 January 2019)
- ""Find an Altitude" Google Maps (accessed 31 January 2019)". Archived from the original on May 21, 2019. Retrieved January 31, 2019.
- "2010 Census Gazetteer Files". US Census Bureau. August 22, 2012. Retrieved March 23, 2015.
- Map of Time Zone Line through South Dakota (accessed 30 January 2019)
- Pocasse National Wildlife Refuge, Pollock SD Google Maps (accessed 31 January 2019)
- Rogo Bay Recreation Area, Glenham SD Google Maps (accessed 31 January 2019)
- Salt Lake State Shooting Area, Java SD Google Maps (accessed 31 January 2019)
- Sand Lake State Game Refuge, Selby SD Google Maps (accessed 31 January 2019)
- Shaw Creek Recreation Area, Herreid SD Google Maps (accessed 31 January 2019)
- West Pollock Recreation Area, Pollock SD Google Maps (accessed 31 January 2019)
- "Annual Estimates of the Resident Population for Counties: April 1, 2010 to July 1, 2019". Retrieved April 10, 2020.
- "US Decennial Census". US Census Bureau. Retrieved March 23, 2015.
- "Historical Census Browser". University of Virginia Library. Retrieved March 23, 2015.
- Forstall, Richard L., ed. (March 27, 1995). "Population of Counties by Decennial Census: 1900 to 1990". US Census Bureau. Retrieved March 23, 2015.
- "Census 2000 PHC-T-4. Ranking Tables for Counties: 1990 and 2000" (PDF). US Census Bureau. April 2, 2001. Retrieved March 23, 2015.
- "U.S. Census website". US Census Bureau. Retrieved May 14, 2011.
- "Profile of General Population and Housing Characteristics: 2010 Demographic Profile Data". US Census Bureau. Archived from the original on February 13, 2020. Retrieved March 11, 2016.
- "Population, Housing Units, Area, and Density: 2010 - County". US Census Bureau. Archived from the original on February 13, 2020. Retrieved March 11, 2016.
- "Selected Social Characteristics in the US – 2006-2010 American Community Survey 5-Year Estimates". US Census Bureau. Archived from the original on February 13, 2020. Retrieved March 11, 2016.
- "Selected Economic Characteristics – 2006-2010 American Community Survey 5-Year Estimates". US Census Bureau. Archived from the original on February 13, 2020. Retrieved March 11, 2016.
- www.thearda.com/rcms2010/r/c/46/rcms2010_46021_county_name_2010.asp ARDA
- North Campbell SD Google Maps (accessed 31 January 2019)
- South Campbell SD Google Maps (accessed 31 January 2019)
- Dave Leip’s U.S. Election Atlas; 1952 Presidential Election Statistics
- Leip, David. "Atlas of US Presidential Elections". uselectionatlas.org. Retrieved April 13, 2018.
Places adjacent to Campbell County, South Dakota | ||||||||||
|---|---|---|---|---|---|---|---|---|---|---|
| ||||||||||
Municipalities and communities of Campbell County, South Dakota, United States | ||
|---|---|---|
| City | | |
| Towns | ||
| Unorganized territories |
| |
| ||
