Tripp County, South Dakota
Tripp County is a county in the U.S. state of South Dakota. As of the 2010 census, the population was 5,644.[1] Its county seat is Winner.[2] The county was created in 1873, and was organized in 1909.[3] It is named for lawyer, judge, and diplomat Bartlett Tripp.
Tripp County | |
|---|---|
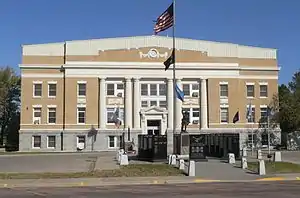 Tripp County courthouse in Winner | |
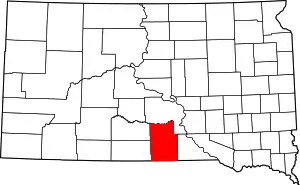 Location within the U.S. state of South Dakota | |
 South Dakota's location within the U.S. | |
| Coordinates: 43°20′N 99°53′W | |
| Country | |
| State | |
| Founded | 1873 (created) 1909 (organized) |
| Named for | Bartlett Tripp |
| Seat | Winner |
| Largest city | Winner |
| Area | |
| • Total | 1,618 sq mi (4,190 km2) |
| • Land | 1,612 sq mi (4,180 km2) |
| • Water | 5.1 sq mi (13 km2) 0.3% |
| Population (2010) | |
| • Total | 5,644 |
| • Estimate (2018) | 5,478 |
| • Density | 3.5/sq mi (1.3/km2) |
| Time zone | UTC−6 (Central) |
| • Summer (DST) | UTC−5 (CDT) |
| Congressional district | At-large |
| Website | trippcounty |
Geography
Tripp County lies on the south line of South Dakota. Its south boundary is the Nebraska state line, while its north boundary is the meandering White River. The Keya Paha River flows east-southeasterly through the lower part of the county. The county terrain is composed of rolling hills carved by gullies and drainages.[4] The county terrain generally slopes to the south and east, although its upper portion drops northward into the White River valley. The county's highest point is on the lower part of its west boundary line, at 2,552' (778m) ASL.[5] The county has a total area of 1,618 square miles (4,190 km2), of which 1,612 square miles (4,180 km2) is land and 5.1 square miles (13 km2) (0.3%) is water.[6]
Major highways
Adjacent counties
- Lyman County - north
- Gregory County - east
- Keya Paha County, Nebraska - south
- Cherry County, Nebraska - southwest
- Todd County - west
- Mellette County - northwest
Protected areas[4]
- Beaulieu Lake State Game Production Area
- Brown State Game Production Area
- Covey Dam State Game Production Area
- Dog Ear Lake State Game Production Area
- George & Katherine Mann State Game Production Area
- Ideal Wetland State Game Production Area
- King Dam State Game Production Area
- Little Dog Ear Lake State Game Production Area
- McLaughlin State Game Production Area
- Rahm Lake State Game Production Area
- Roosevelt Lake State Game Production Area
- Snow Dam State Game Production Area
Lakes[4]
- Roosevelt Lake
Demographics
| Historical population | |||
|---|---|---|---|
| Census | Pop. | %± | |
| 1910 | 8,323 | — | |
| 1920 | 11,970 | 43.8% | |
| 1930 | 12,712 | 6.2% | |
| 1940 | 9,937 | −21.8% | |
| 1950 | 9,139 | −8.0% | |
| 1960 | 8,761 | −4.1% | |
| 1970 | 8,171 | −6.7% | |
| 1980 | 7,268 | −11.1% | |
| 1990 | 6,924 | −4.7% | |
| 2000 | 6,430 | −7.1% | |
| 2010 | 5,644 | −12.2% | |
| 2019 (est.) | 5,441 | [7] | −3.6% |
| US Decennial Census[8] 1790-1960[9] 1900-1990[10] 1990-2000[11] 2010-2018[1] | |||
2000 census
As of the 2000 United States Census,[12] there were 6,430 people, 2,550 households, and 1,721 families in the county. The population density was 4 people per square mile (2/km2). There were 3,036 housing units at an average density of 2 per square mile (1/km2). The racial makeup of the county was 87.48% White, 0.03% Black or African American, 11.20% Native American, 0.06% Asian, 0.08% from other races, and 1.15% from two or more races. 0.86% of the population were Hispanic or Latino of any race.
There were 2,550 households, out of which 30.40% had children under the age of 18 living with them, 56.90% were married couples living together, 6.60% had a female householder with no husband present, and 32.50% were non-families. 29.60% of all households were made up of individuals, and 15.70% had someone living alone who was 65 years of age or older. The average household size was 2.48 and the average family size was 3.08.
The county population contained 27.70% under the age of 18, 6.20% from 18 to 24, 24.40% from 25 to 44, 21.90% from 45 to 64, and 19.70% who were 65 years of age or older. The median age was 40 years. For every 100 females there were 97.40 males. For every 100 females age 18 and over, there were 94.70 males.
The median income for a household in the county was $28,333, and the median income for a family was $36,219. Males had a median income of $22,588 versus $18,070 for females. The per capita income for the county was $13,776. About 15.90% of families and 19.90% of the population were below the poverty line, including 20.70% of those under age 18 and 17.60% of those age 65 or over.
2010 census
As of the 2010 United States Census, there were 5,644 people, 2,419 households, and 1,509 families in the county.[13] The population density was 3.5 inhabitants per square mile (1.4/km2). There were 3,072 housing units at an average density of 1.9 per square mile (0.73/km2).[14] The racial makeup of the county was 83.1% white, 14.0% American Indian, 0.2% Asian, 0.1% black or African American, 0.2% from other races, and 2.4% from two or more races. Those of Hispanic or Latino origin made up 1.1% of the population.[13] In terms of ancestry, 46.8% were German, 10.8% were Irish, 7.7% were Czech, 6.2% were Dutch, and 4.0% were American.[15]
Of the 2,419 households, 26.9% had children under the age of 18 living with them, 50.4% were married couples living together, 8.4% had a female householder with no husband present, 37.6% were non-families, and 34.6% of all households were made up of individuals. The average household size was 2.28 and the average family size was 2.93. The median age was 45.3 years.[13]
The median income for a household in the county was $40,221 and the median income for a family was $49,570. Males had a median income of $35,238 versus $25,323 for females. The per capita income for the county was $21,192. About 12.1% of families and 16.5% of the population were below the poverty line, including 27.4% of those under age 18 and 10.3% of those age 65 or over.[16]
Communities
Census-designated place
- Hamill (Population:11)
Unincorporated communities
Townships
- Banner
- Beaver Creek
- Black
- Brunson
- Bull Creek
- Carter
- Colome
- Condon
- Curlew
- Dog Ear
- Elliston
- Greenwood
- Holsclaw
- Huggins
- Ideal
- Irwin
- Jordan
- Keyapaha
- King
- Lake
- Lamro
- Lincoln
- Lone Star
- Lone Tree
- McNeely
- Millboro
- Pahapesto
- Plainview
- Pleasant Valley
- Pleasant View
- Progressive
- Rames
- Rosedale
- Roseland
- Star Prairie
- Star Valley
- Stewart
- Sully
- Taylor
- Valley
- Weave
- Willow Creek
- Wilson
- Witten
- Wortman
- Wright
Unorganized territory
The county contains one area of unorganized territory: Gassman.
Politics
Tripp County voters have traditionally voted Republican. In no national election since 1964 has the county selected the Democratic Party candidate (as of 2016). The Democratic Party has not obtained forty percent of the county's vote since Jimmy Carter in 1976.
| Year | Republican | Democratic | Third parties |
|---|---|---|---|
| 2020 | 80.2% 2,161 | 18.4% 495 | 1.5% 40 |
| 2016 | 78.7% 2,069 | 17.6% 462 | 3.8% 99 |
| 2012 | 70.8% 1,905 | 27.4% 737 | 1.8% 49 |
| 2008 | 65.5% 1,859 | 32.2% 914 | 2.3% 66 |
| 2004 | 68.7% 2,230 | 30.0% 972 | 1.3% 43 |
| 2000 | 69.0% 1,909 | 28.9% 799 | 2.1% 57 |
| 1996 | 53.6% 1,680 | 34.7% 1,088 | 11.6% 364 |
| 1992 | 43.4% 1,459 | 31.1% 1,046 | 25.5% 858 |
| 1988 | 63.0% 2,113 | 36.3% 1,219 | 0.7% 24 |
| 1984 | 72.2% 2,483 | 27.2% 935 | 0.6% 22 |
| 1980 | 70.7% 2,669 | 25.1% 947 | 4.2% 160 |
| 1976 | 51.9% 1,980 | 47.7% 1,822 | 0.4% 15 |
| 1972 | 62.7% 2,592 | 37.2% 1,538 | 0.1% 2 |
| 1968 | 58.3% 2,242 | 35.4% 1,362 | 6.4% 245 |
| 1964 | 46.4% 1,937 | 53.6% 2,241 | |
| 1960 | 58.5% 2,466 | 41.5% 1,748 | |
| 1956 | 52.9% 2,064 | 47.1% 1,835 | |
| 1952 | 65.9% 2,790 | 34.1% 1,445 | |
| 1948 | 48.3% 1,845 | 50.2% 1,918 | 1.4% 55 |
| 1944 | 53.8% 1,911 | 46.2% 1,640 | |
| 1940 | 54.4% 2,492 | 45.6% 2,089 | |
| 1936 | 37.8% 1,693 | 60.4% 2,708 | 1.9% 84 |
| 1932 | 23.7% 1,147 | 75.3% 3,647 | 1.1% 52 |
| 1928 | 53.0% 2,396 | 46.5% 2,099 | 0.5% 24 |
| 1924 | 42.5% 1,647 | 24.0% 932 | 33.5% 1,301 |
| 1920 | 59.3% 1,819 | 31.6% 968 | 9.1% 279 |
| 1916 | 43.6% 1,074 | 54.4% 1,341 | 2.0% 50 |
| 1912 | 43.7% 982 | 56.3% 1,267 |
References
- "State & County QuickFacts". United States Census Bureau. Retrieved November 28, 2013.
- "Find a County". National Association of Counties. Retrieved June 7, 2011.
- "Dakota Territory, South Dakota, and North Dakota: Individual County Chronologies". Dakota Territory Atlas of Historical County Boundaries. The Newberry Library. 2006. Retrieved March 31, 2015.
- Tripp County SD Google Maps (accessed 8 February 2019)
- ""Find an Altitude" Google Maps (accessed 8 February 2019)". Archived from the original on May 21, 2019. Retrieved February 9, 2019.
- "2010 Census Gazetteer Files". US Census Bureau. August 22, 2012. Retrieved March 28, 2015.
- "Annual Estimates of the Resident Population for Counties: April 1, 2010 to July 1, 2019". Retrieved April 10, 2020.
- "US Decennial Census". United States Census Bureau. Retrieved March 28, 2015.
- "Historical Census Browser". University of Virginia Library. Retrieved March 28, 2015.
- Forstall, Richard L., ed. (March 27, 1995). "Population of Counties by Decennial Census: 1900 to 1990". US Census Bureau. Retrieved March 28, 2015.
- "Census 2000 PHC-T-4. Ranking Tables for Counties: 1990 and 2000" (PDF). US Census Bureau. April 2, 2001. Retrieved March 28, 2015.
- "U.S. Census website". US Census Bureau. Retrieved May 14, 2011.
- "Profile of General Population and Housing Characteristics: 2010 Demographic Profile Data". US Census Bureau. Archived from the original on February 13, 2020. Retrieved March 12, 2016.
- "Population, Housing Units, Area, and Density: 2010 - County". US Census Bureau. Archived from the original on February 13, 2020. Retrieved March 12, 2016.
- "Selected Social Characteristics in the US – 2006-2010 American Community Survey 5-Year Estimates". US Census Bureau. Archived from the original on February 13, 2020. Retrieved March 12, 2016.
- "Selected Economic Characteristics – 2006-2010 American Community Survey 5-Year Estimates". US Census Bureau. Archived from the original on February 13, 2020. Retrieved March 12, 2016.
- Leip, David. "Atlas of US Presidential Elections". uselectionatlas.org. Retrieved April 15, 2018.
Places adjacent to Tripp County, South Dakota | ||||||||||
|---|---|---|---|---|---|---|---|---|---|---|
| ||||||||||
Municipalities and communities of Tripp County, South Dakota, United States | ||
|---|---|---|
| Cities | Tripp County map | |
| Town | ||
| CDP | ||
| Unincorporated communities | ||
| Indian reservation | ||
| Footnotes | ‡This populated place also has portions in an adjacent county or counties | |
| ||

| Authority control |
|---|