Sully County, South Dakota
Sully County is a county in the U.S. state of South Dakota. As of the 2010 United States Census, the population was 1,373,[1] making it the third-least populous county in South Dakota. Its county seat is Onida.[2] The county was created in 1873 and organized in 1883.[3] It is named after General Alfred Sully, who built Fort Sully.[4]
Sully County | |
|---|---|
 Sully Courthouse (2013) | |
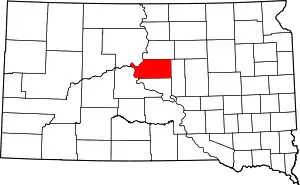 Location within the U.S. state of South Dakota | |
 South Dakota's location within the U.S. | |
| Coordinates: 44.71°N 100.13°W | |
| Country | |
| State | |
| Founded | 1873 (created) 1883 (organized) |
| Named for | Alfred Sully |
| Seat | Onida |
| Largest city | Onida |
| Area | |
| • Total | 1,070 sq mi (2,800 km2) |
| • Land | 1,007 sq mi (2,610 km2) |
| • Water | 63 sq mi (160 km2) 5.9% |
| Population (2010) | |
| • Total | 1,373 |
| • Estimate (2018) | 1,392 |
| • Density | 1.3/sq mi (0.50/km2) |
| Time zone | UTC−6 (Central) |
| • Summer (DST) | UTC−5 (CDT) |
| Congressional district | At-large |
| Website | www |
Sully County is included in the Pierre, SD Micropolitan Statistical Area.
Geography
The west boundary line of Sully County is defined by the meanderings of the Missouri River, which flows southward along its edge. The county's terrain is composed of semi-arid rolling hills, partially devoted to agriculture.[5] The terrain slopes to the south and east, but the west portion of the county slopes westward into the river valley. The county's highest point is along the midpoint of its north boundary line, at 1,949' (594m) ASL.[6] The county has a total area of 1,070 square miles (2,800 km2), of which 1,007 square miles (2,610 km2) is land and 63 square miles (160 km2) (5.9%) is water.[7]
The eastern portion of South Dakota's counties (48 of 66) observe Central Time; the western counties (18 of 66) observe Mountain Time. Sully County is at the western edge of those counties that observe Central Time.[8]
Major highways
 U.S. Highway 83
 South Dakota Highway 1804
Adjacent counties
- Potter County – north
- Hyde County – east
- Hughes County – south
- Stanley County – southwest (observes mountain time)
- Dewey County – northwest (observes Mountain Time)
Protected areas[5]
- Bush's Landing State Lakeside Use Area
- Cottonwood Lake State Game Production Area
- Cow Creek State Game Production Area
- Cow Creek State Recreation Area
- Elk State Game Production Area
- Fort Sully State Game Production Area
- Hofer State Game Production Area
- Koenig State Game Production Area Area
- Lambrecht State Game Production Area
- Lake State Game Production Area
- Little Bend State Game Production Area
- Little Bend State Lakeside Use Area Area
- Mail Shack State Game Production Area
- Medicine Knoll Creek State Game Production Area
- Okobojo Creek State Game Production Area
- Okobojo Point State Recreation Area
- Onida State Game Production Area
- Pleasant State Game Production Area
- Spring Creek Recreation Area
- Stone Lake State Game Production Area
- Sutton Bay State Game Production Area
- Sutton Bay State Lakeside Use Area
Demographics
| Historical population | |||
|---|---|---|---|
| Census | Pop. | %± | |
| 1880 | 296 | — | |
| 1890 | 2,412 | 714.9% | |
| 1900 | 1,715 | −28.9% | |
| 1910 | 2,462 | 43.6% | |
| 1920 | 2,831 | 15.0% | |
| 1930 | 3,852 | 36.1% | |
| 1940 | 2,668 | −30.7% | |
| 1950 | 2,713 | 1.7% | |
| 1960 | 2,607 | −3.9% | |
| 1970 | 2,362 | −9.4% | |
| 1980 | 1,990 | −15.7% | |
| 1990 | 1,589 | −20.2% | |
| 2000 | 1,556 | −2.1% | |
| 2010 | 1,373 | −11.8% | |
| 2019 (est.) | 1,391 | [9] | 1.3% |
| US Decennial Census[10] 1790–1960[11] 1900–1990[12] 1990–2000[13] 2010–2018[1] | |||
2000 census
As of the 2000 United States Census,[14] there were 1,556 people, 630 households, and 442 families in the County. The population density was 2 people per square mile (1/km2). There were 844 housing units at an average density of 0.8 per square mile (0.3/km2). The racial makeup of Sully County was 97.81% White, 0.77% Native American, 0.13% Asian, 0.13% from other races, and 1.16% from two or more races. 0.77% of the population were Hispanic or Latino of any race.
There were 630 households, out of which 31.00% had children under the age of 18 living with them, 62.50% were married couples living together, 4.30% had a female householder with no husband present, and 29.70% were non-families. 25.70% of all households were made up of individuals, and 10.60% had someone living alone who was 65 years of age or older. The average household size was 2.47 and the average family size was 2.99.
The county population contained 25.50% under the age of 18, 6.10% from 18 to 24, 26.50% from 25 to 44, 24.40% from 45 to 64, and 17.40% who were 65 years of age or older. The median age was 40 years. For every 100 females there were 105.50 males. For every 100 females age 18 and over, there were 108.50 males.
The median income for a household in the county was $32,500, and the median income for a family was $38,304. Males had a median income of $25,265 versus $20,521 for females. The per capita income for the county was $17,407. About 10.60% of families and 12.10% of the population were below the poverty line, including 13.40% of those under age 18 and 15.10% of those age 65 or over.
2010 census
As of the 2010 United States Census, there were 1,373 people, 610 households, and 397 families in the county.[15] The population density was 1.4 inhabitants per square mile (0.54/km2). There were 845 housing units at an average density of 0.84 per square mile (0.32/km2).[16] The racial makeup of the county was 96.6% white, 1.2% American Indian, 0.1% black or African American, 0.0% from other races, and 2.2% from two or more races. Those of Hispanic or Latino origin made up 0.9% of the population.[15] In terms of ancestry,[17]
Of the 610 households, 27.0% had children under the age of 18 living with them, 57.5% were married couples living together, 4.6% had a female householder with no husband present, 34.9% were non-families, and 31.6% of all households were made up of individuals. The average household size was 2.25 and the average family size was 2.82. The median age was 46.6 years.[15]
The median income for a household in the county was $48,958 and the median income for a family was $58,875. Males had a median income of $34,375 versus $29,087 for females. The per capita income for the county was $26,596. About 4.4% of families and 8.0% of the population were below the poverty line, including 12.8% of those under age 18 and 8.4% of those age 65 or over.[18]
Communities
City
- Onida (county seat)
Town
Census-designated place
Unorganized territories
The county organization does not include division into townships. Its area is divided into two areas of unorganized territory: West Sully and East Sully.
Politics
Throughout its history, Sully County has been powerfully Republican. The solitary Democrat to carry Sully County at a Presidential level has been Franklin D. Roosevelt in 1932 during an election heavily influenced by the "Dust Bowl" and Great Depression. Nonetheless, in the following 1936 election, Alf Landon won the county by over twenty percent. Since that time, the Democratic Party has bettered FDR's 1936 effort five times, but only Lyndon Johnson in 1964 has held the GOP to a single-figure margin. In modern times, like almost all of rural America, Sully County has become more and more Republican. The last Democrat to carry one-third of the County's vote was Michael Dukakis in 1988 during an election severely affected by a major drought.
| Year | Republican | Democratic | Third parties |
|---|---|---|---|
| 2016 | 78.9% 679 | 15.9% 137 | 5.2% 45 |
| 2012 | 74.9% 613 | 22.7% 186 | 2.3% 19 |
| 2008 | 69.8% 581 | 28.0% 233 | 2.3% 19 |
| 2004 | 76.6% 702 | 21.9% 201 | 1.5% 14 |
| 2000 | 72.7% 633 | 24.0% 209 | 3.3% 29 |
| 1996 | 57.8% 592 | 31.3% 321 | 10.9% 112 |
| 1992 | 55.9% 565 | 27.0% 273 | 17.0% 172 |
| 1988 | 56.8% 571 | 39.1% 393 | 4.2% 42 |
| 1984 | 75.5% 836 | 24.0% 266 | 0.5% 5 |
| 1980 | 74.2% 852 | 19.2% 220 | 6.7% 77 |
| 1976 | 55.3% 630 | 44.3% 505 | 0.4% 4 |
| 1972 | 64.9% 773 | 34.8% 414 | 0.3% 4 |
| 1968 | 60.1% 676 | 31.6% 356 | 8.3% 93 |
| 1964 | 52.8% 667 | 47.2% 596 | |
| 1960 | 64.1% 864 | 35.9% 483 | |
| 1956 | 59.5% 726 | 40.5% 494 | |
| 1952 | 71.0% 860 | 29.0% 352 | |
| 1948 | 58.4% 579 | 40.8% 405 | 0.8% 8 |
| 1944 | 67.1% 612 | 32.9% 300 | |
| 1940 | 64.7% 840 | 35.3% 458 | |
| 1936 | 58.6% 667 | 38.4% 437 | 3.0% 34 |
| 1932 | 35.6% 559 | 61.3% 961 | 3.1% 49 |
| 1928 | 70.5% 999 | 29.3% 415 | 0.2% 3 |
| 1924 | 59.0% 555 | 14.7% 138 | 26.3% 247 |
| 1920 | 63.0% 542 | 17.1% 147 | 20.0% 172 |
| 1916 | 50.5% 281 | 48.1% 268 | 1.4% 8 |
| 1912 | 42.3% 242 | 57.7% 330 | |
| 1908 | 68.3% 368 | 28.6% 154 | 3.2% 17 |
| 1904 | 82.9% 364 | 11.4% 50 | 5.7% 25 |
| 1900 | 64.8% 294 | 33.5% 152 | 1.8% 8 |
| 1896 | 56.3% 262 | 42.6% 198 | 1.1% 5 |
| 1892 | 57.4% 278 | 8.1% 39 | 34.5% 167 |
References
- "State & County QuickFacts". United States Census Bureau. Retrieved November 28, 2013.
- "Find a County". National Association of Counties. Retrieved June 7, 2011.
- "Dakota Territory, South Dakota, and North Dakota: Individual County Chronologies". Dakota Territory Atlas of Historical County Boundaries. The Newberry Library. 2006. Retrieved March 31, 2015.
- Legislative Manual, South Dakota, 2005, p. 597.
- Sully County SD Google Maps (accessed 8 February 2019)
- ""Find an Altitude" Google Maps (accessed 8 February 2019)". Archived from the original on May 21, 2019. Retrieved February 9, 2019.
- "2010 Census Gazetteer Files". US Census Bureau. August 22, 2012. Retrieved March 28, 2015.
- Map of Time Zone Line through South Dakota (accessed 30 January 2019)
- "Annual Estimates of the Resident Population for Counties: April 1, 2010 to July 1, 2019". Retrieved April 10, 2020.
- "US Decennial Census". US Census Bureau. Retrieved March 28, 2015.
- "Historical Census Browser". University of Virginia Library. Retrieved March 28, 2015.
- Forstall, Richard L., ed. (March 27, 1995). "Population of Counties by Decennial Census: 1900 to 1990". US Census Bureau. Retrieved March 28, 2015.
- "Census 2000 PHC-T-4. Ranking Tables for Counties: 1990 and 2000" (PDF). US Census Bureau. April 2, 2001. Retrieved March 28, 2015.
- "U.S. Census website". US Census Bureau. Retrieved May 14, 2011.
- "Profile of General Population and Housing Characteristics: 2010 Demographic Profile Data". US Census Bureau]]. Archived from the original on February 13, 2020. Retrieved March 12, 2016.
- "Population, Housing Units, Area, and Density: 2010 – County". US Census Bureau. Archived from the original on February 13, 2020. Retrieved March 12, 2016.
- "Selected Social Characteristics in the US – 2006–2010 American Community Survey 5-Year Estimates". US Census Bureau. Archived from the original on February 13, 2020. Retrieved March 12, 2016.
- "Selected Economic Characteristics – 2006–2010 American Community Survey 5-Year Estimates". US Census Bureau. Archived from the original on February 13, 2020. Retrieved March 12, 2016.
- Leip, David. "Atlas of US Presidential Elections". uselectionatlas.org. Retrieved April 15, 2018.
Places adjacent to Sully County, South Dakota | ||||||||||
|---|---|---|---|---|---|---|---|---|---|---|
| ||||||||||
Municipalities and communities of Sully County, South Dakota, United States | ||
|---|---|---|
| City | | |
| Town | ||
| CDP | ||
| ||
