McCook County, South Dakota
McCook County is a county in the U.S. state of South Dakota. At the 2010 census, the population was 5,618.[1] Its county seat is Salem.[2] The county was established in 1873, and was organized in 1878.[3] It was named for the former governor of the Dakota Territory and Civil War general Edwin Stanton McCook.[4][5]
McCook County | |
|---|---|
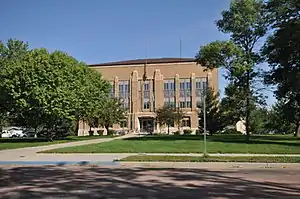 McCook County Courthouse | |
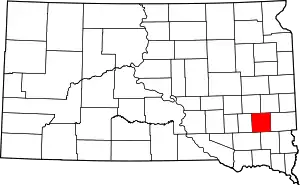 Location within the U.S. state of South Dakota | |
 South Dakota's location within the U.S. | |
| Coordinates: 43°40′N 97°22′W | |
| Country | |
| State | |
| Founded | January 8, 1873 (created) June 15, 1878 (organized) |
| Named for | Edwin Stanton McCook |
| Seat | Salem |
| Largest city | Salem |
| Area | |
| • Total | 577 sq mi (1,490 km2) |
| • Land | 574 sq mi (1,490 km2) |
| • Water | 2.7 sq mi (7 km2) 0.5% |
| Population (2010) | |
| • Total | 5,618 |
| • Estimate (2018) | 5,546 |
| • Density | 9.7/sq mi (3.8/km2) |
| Time zone | UTC−6 (Central) |
| • Summer (DST) | UTC−5 (CDT) |
| Congressional district | At-large |
| Website | www |
McCook County is part of the Sioux Falls, SD Metropolitan Statistical Area.
Geography
The terrain of McCook County consists of rolling hills, mostly devoted to agriculture.[6] The terrain slopes to the south and southwest; its highest point is near its northeast corner, at 1,798' (548m) ASL.[7] The county has a total area of 577 square miles (1,490 km2), of which 574 square miles (1,490 km2) is land and 2.7 square miles (7.0 km2) (0.5%) is water.[8]
Major highways
 Interstate 90
 U.S. Highway 81
 South Dakota Highway 38
 South Dakota Highway 42
Adjacent counties
- Lake County - northeast
- Minnehaha County - east
- Turner County - southeast
- Hutchinson County - southwest
- Hanson County - west
- Miner County - northwest
Protected areas[6]
- Ediger State Public Shooting Area
- Forsch Lake State Public Shooting Area
- Lake Vermillion Recreation Area
- Lehrman Slough State Public Shooting Area
- Tschetter Slough State Public Shooting Area
Lakes[6]
- East Vermillion Lake AKA Lake Vermillion
- Island Lake
- Lake Ell
Demographics
| Historical population | |||
|---|---|---|---|
| Census | Pop. | %± | |
| 1880 | 1,283 | — | |
| 1890 | 6,448 | 402.6% | |
| 1900 | 8,689 | 34.8% | |
| 1910 | 9,589 | 10.4% | |
| 1920 | 9,990 | 4.2% | |
| 1930 | 10,316 | 3.3% | |
| 1940 | 9,793 | −5.1% | |
| 1950 | 8,828 | −9.9% | |
| 1960 | 8,268 | −6.3% | |
| 1970 | 7,246 | −12.4% | |
| 1980 | 6,444 | −11.1% | |
| 1990 | 5,688 | −11.7% | |
| 2000 | 5,832 | 2.5% | |
| 2010 | 5,618 | −3.7% | |
| 2019 (est.) | 5,586 | [9] | −0.6% |
| US Decennial Census[10] 1790-1960[11] 1900-1990[12] 1990-2000[13] 2010-2018[1] | |||
2000 census
As of the 2000 United States Census,[14] there were 5,832 people, 2,204 households, and 1,558 families in the county. The population density was 10 people per square mile (4/km2). There were 2,383 housing units at an average density of 4 per square mile (2/km2). The racial makeup of the county was 98.87% White, 0.05% Black or African American, 0.36% Native American, 0.21% Asian, 0.15% from other races, and 0.36% from two or more races. 0.77% of the population were Hispanic or Latino of any race.
There were 2,204 households, out of which 34.10% had children under the age of 18 living with them, 62.10% were married couples living together, 5.10% had a female householder with no husband present, and 29.30% were non-families. 26.80% of all households were made up of individuals, and 15.60% had someone living alone who was 65 years of age or older. The average household size was 2.58 and the average family size was 3.15.
The county population Contained 28.40% under the age of 18, 6.20% from 18 to 24, 25.50% from 25 to 44, 20.40% from 45 to 64, and 19.50% who were 65 years of age or older. The median age was 39 years. For every 100 females, there were 99.50 males. For every 100 females age 18 and over, there were 97.20 males.
The median income for a household in the county was $35,396, and the median income for a family was $42,609. Males had a median income of $28,390 versus $21,073 for females. The per capita income for the county was $16,374. About 5.50% of families and 8.10% of the population were below the poverty line, including 8.90% of those under age 18 and 8.80% of those age 65 or over.
2010 census
As of the 2010 United States Census, there were 5,618 people, 2,168 households, and 1,535 families in the county.[15] The population density was 9.8 inhabitants per square mile (3.8/km2). There were 2,491 housing units at an average density of 4.3 per square mile (1.7/km2).[16] The racial makeup of the county was 98.0% white, 0.4% American Indian, 0.1% Pacific islander, 0.1% Asian, 0.1% black or African American, 0.6% from other races, and 0.7% from two or more races. Those of Hispanic or Latino origin made up 1.8% of the population.[15] In terms of ancestry, 61.5% were German, 12.8% were Irish, 11.1% were Norwegian, 7.4% were Swedish, 6.2% were Dutch, 5.2% were English, and 3.5% were American.[17]
Of the 2,168 households, 30.4% had children under the age of 18 living with them, 61.0% were married couples living together, 6.0% had a female householder with no husband present, 29.2% were non-families, and 26.2% of all households were made up of individuals. The average household size was 2.45 and the average family size was 2.94. The median age was 42.7 years.[15]
The median income for a household in the county was $42,022 and the median income for a family was $57,287. Males had a median income of $35,951 versus $29,750 for females. The per capita income for the county was $25,502. About 5.2% of families and 7.9% of the population were below the poverty line, including 6.7% of those under age 18 and 14.4% of those age 65 or over.[18]
Politics
McCook County voters usually vote Republican. Although the county was one only 130 nationwide to support favorite son George McGovern in 1972, it has selected the Democratic nominee in only six other elections since South Dakota's statehood, and none since 1980. Despite the fact that George Bush senior won the county in 1988 and 1992 by a combined total of nineteen votes, like almost all rural white counties McCook has shifted abruptly towards the GOP since then due to opposition to the Democratic Party's liberal social views.
| Year | Republican | Democratic | Third parties |
|---|---|---|---|
| 2020 | 71.3% 2,068 | 26.5% 769 | 2.2% 63 |
| 2016 | 69.4% 1,794 | 24.1% 623 | 6.6% 170 |
| 2012 | 63.3% 1,655 | 34.6% 905 | 2.0% 53 |
| 2008 | 55.9% 1,646 | 41.4% 1,219 | 2.7% 80 |
| 2004 | 61.7% 2,017 | 36.7% 1,201 | 1.6% 53 |
| 2000 | 61.2% 1,610 | 36.7% 965 | 2.1% 56 |
| 1996 | 47.5% 1,292 | 42.8% 1,166 | 9.7% 265 |
| 1992 | 39.4% 1,177 | 39.1% 1,167 | 21.5% 640 |
| 1988 | 50.0% 1,501 | 49.7% 1,492 | 0.3% 9 |
| 1984 | 56.6% 1,902 | 43.1% 1,448 | 0.4% 12 |
| 1980 | 56.8% 2,014 | 34.5% 1,223 | 8.7% 307 |
| 1976 | 48.7% 1,744 | 50.9% 1,822 | 0.3% 12 |
| 1972 | 49.5% 1,963 | 50.3% 1,993 | 0.2% 7 |
| 1968 | 51.6% 1,959 | 43.5% 1,653 | 5.0% 188 |
| 1964 | 44.6% 1,756 | 55.4% 2,181 | |
| 1960 | 56.9% 2,375 | 43.1% 1,797 | |
| 1956 | 77.9% 2,225 | 22.2% 633 | |
| 1952 | 72.6% 2,991 | 27.4% 1,127 | |
| 1948 | 59.5% 2,064 | 40.0% 1,387 | 0.6% 20 |
| 1944 | 68.4% 2,516 | 31.6% 1,163 | |
| 1940 | 66.1% 3,310 | 33.9% 1,696 | |
| 1936 | 43.6% 2,117 | 52.3% 2,536 | 4.1% 198 |
| 1932 | 32.5% 1,436 | 65.2% 2,884 | 2.3% 102 |
| 1928 | 55.8% 2,234 | 43.9% 1,758 | 0.3% 13 |
| 1924 | 44.3% 1,368 | 14.8% 457 | 40.9% 1,265 |
| 1920 | 60.5% 1,864 | 18.3% 565 | 21.1% 651 |
| 1916 | 52.2% 1,194 | 44.6% 1,021 | 3.2% 73 |
| 1912 | 44.6% 962 | 55.4% 1,193 | |
| 1908 | 57.0% 1,209 | 38.9% 826 | 4.1% 86 |
| 1904 | 63.0% 1,284 | 34.0% 693 | 3.0% 61 |
| 1900 | 49.1% 978 | 49.6% 989 | 1.3% 26 |
| 1896 | 39.0% 678 | 60.3% 1,047 | 0.7% 12 |
| 1892 | 37.4% 573 | 17.1% 262 | 45.6% 699 |
Communities
Unincorporated communities[6]
- Stanley Corner
- Unityville
Townships
The county is divided into sixteen townships:
- Benton
- Bridgewater
- Brookfield
- Canistota
- Emery
- Grant
- Greenland
- Jefferson
- Pearl
- Montrose
- Union
- Ramsey
- Richland
- Salem
- Spring Valley
- Sun Prairie
Other places
- Laurent - (proposed / abandoned housing development)
References
- "State & County QuickFacts". United States Census Bureau. Archived from the original on June 7, 2011. Retrieved November 25, 2013.
- "Find a County". National Association of Counties. Archived from the original on May 31, 2011. Retrieved June 7, 2011.
- "Dakota Territory, South Dakota, and North Dakota: Individual County Chronologies". The Newberry Library. 2006. Retrieved March 30, 2015.
- Hellmann, Paul T. (May 13, 2013). Historical Gazetteer of the United States. Routledge. p. 997. ISBN 978-1135948597. Retrieved November 30, 2013.
- Chicago and North Western Railway Company (1908). A History of the Origin of the Place Names Connected with the Chicago & North Western and Chicago, St. Paul, Minneapolis & Omaha Railways. p. 162.
- McCook County SD Google Maps (accessed 5 February 2019)
- ""Find an Altitude" Google Maps (accessed 5 February 2019)". Archived from the original on May 21, 2019. Retrieved February 6, 2019.
- "2010 Census Gazetteer Files". US Census Bureau. August 24, 2012. Retrieved March 28, 2015.
- "Annual Estimates of the Resident Population for Counties: April 1, 2010 to July 1, 2019". Retrieved April 10, 2020.
- "US Decennial Census". US Census Bureau. Retrieved March 28, 2015.
- "Historical Census Browser". University of Virginia Library. Retrieved March 28, 2015.
- Forstall, Richard L., ed. (March 27, 1995). "Population of Counties by Decennial Census: 1900 to 1990". US Census Bureau. Retrieved March 28, 2015.
- "Census 2000 PHC-T-4. Ranking Tables for Counties: 1990 and 2000" (PDF). US Census Bureau. April 2, 2001. Retrieved March 28, 2015.
- "U.S. Census website". US Census Bureau. Retrieved May 14, 2011.
- "Profile of General Population and Housing Characteristics: 2010 Demographic Profile Data". US Census Bureau. Archived from the original on February 13, 2020. Retrieved March 12, 2016.
- "Population, Housing Units, Area, and Density: 2010 - County". US Census Bureau. Archived from the original on February 13, 2020. Retrieved March 12, 2016.
- "Selected Social Characteristics in the US – 2006-2010 American Community Survey 5-Year Estimates". US Census Bureau. Archived from the original on February 13, 2020. Retrieved March 12, 2016.
- "Selected Economic Characteristics – 2006-2010 American Community Survey 5-Year Estimates". US Census Bureau. Archived from the original on February 13, 2020. Retrieved March 12, 2016.
- Leip, David. "Atlas of US Presidential Elections". uselectionatlas.org. Retrieved April 15, 2018.
- Andrews, John (March 17, 2017). "Inspired by McCook County". South Dakota Magazine.
Places adjacent to McCook County, South Dakota | ||||||||||
|---|---|---|---|---|---|---|---|---|---|---|
| ||||||||||
Municipalities and communities of McCook County, South Dakota, United States | ||
|---|---|---|
| Cities | | |
| Unincorporated community | ||
| ||

| Authority control |
|---|