Roberts County, South Dakota
Roberts County is a county in the U.S. state of South Dakota. As of the 2010 United States Census, the population was 10,149.[2] Its county seat is Sisseton.[3] The county was named either for S. G. Roberts of Fargo, North Dakota, or for Solomon Robar, an early local French fur trader.[1] It was created on March 8, 1883, and fully organized by August 6 of that year. Its boundary was altered once, in 1885.[4]
Roberts County | |
|---|---|
 | |
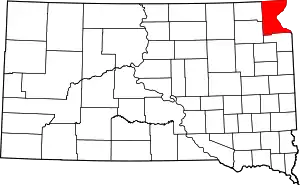 Location within the U.S. state of South Dakota | |
 South Dakota's location within the U.S. | |
| Coordinates: 45°37′N 96°57′W | |
| Country | |
| State | |
| Founded | March 8, 1883 (organized)[1] August 6, 1883 (organized) |
| Named for | S. G. Roberts |
| Seat | Sisseton |
| Largest city | Sisseton |
| Area | |
| • Total | 1,136 sq mi (2,940 km2) |
| • Land | 1,101 sq mi (2,850 km2) |
| • Water | 35 sq mi (90 km2) 3.1% |
| Population (2010) | |
| • Total | 10,149 |
| • Estimate (2018) | 10,447 |
| • Density | 8.9/sq mi (3.4/km2) |
| Time zone | UTC−6 (Central) |
| • Summer (DST) | UTC−5 (CDT) |
| Congressional district | At-large |
| Website | roberts |
Geography
Roberts County is at South Dakota's northeastern corner. Its eastern boundary abuts Minnesota (across the Bois de Sioux River), and its northern boundary abuts North Dakota. The Cottonwood Slough flows southward, draining the upper portion of the county into the River. The terrain consists of rolling hills, devoted to agriculture.[5] The terrain slopes to the east; its highest point is on its upper western boundary line, at 2,047' (624m) ASL.[6]
Roberts County has an area of 1,136 square miles (2,940 km2), of which 1,101 square miles (2,850 km2) is land and 35 square miles (91 km2) (3.1%) is water.[7] The Traverse Gap is in eastern Roberts County along the Minnesota border. The Lake Traverse Indian Reservation covers most of the county.
Major highways
Adjacent counties
- Richland County, North Dakota - north
- Traverse County, Minnesota - northeast
- Big Stone County, Minnesota - southeast
- Grant County - south
- Day County - southwest
- Marshall County - west
Protected areas[5]
- Big Stone Island Nature Area
- Crawford State Wildlife Management Area
- Dry Run No. 2 State Wildlife Management Area
- Dry Run No. 3 State Wildlife Management Area
- Hartford Beach State Park
- Peever Slough State Wildlife Management Area
- Roberts County State Wildlife Management Area
- Sica Hollow State Park (part)
- Upper Lake Traverse State Wildlife Management Area
Lakes and rivers[5]
- Big Stone Lake
- Bois de Sioux River
- Clubhouse Lake
- Cottonwood Lake
- Dobberstien Slough
- Drywood Lakes
- Hurricane Lake
- Lake Bdesska
- Lake Traverse
- Little Minnesota River
- Oneroad Lake
- Owl Lake
- Round Lake
- Whetstone River (North fork)
- Whitestone Lake
Demographics
| Historical population | |||
|---|---|---|---|
| Census | Pop. | %± | |
| 1890 | 1,997 | — | |
| 1900 | 12,216 | 511.7% | |
| 1910 | 14,897 | 21.9% | |
| 1920 | 16,514 | 10.9% | |
| 1930 | 15,782 | −4.4% | |
| 1940 | 15,887 | 0.7% | |
| 1950 | 14,929 | −6.0% | |
| 1960 | 13,190 | −11.6% | |
| 1970 | 11,678 | −11.5% | |
| 1980 | 10,911 | −6.6% | |
| 1990 | 9,914 | −9.1% | |
| 2000 | 10,016 | 1.0% | |
| 2010 | 10,149 | 1.3% | |
| 2019 (est.) | 10,394 | [8] | 2.4% |
| US Decennial Census[9] 1790-1960[10] 1900-1990[11] 1990-2000[12] 2010-2018[2] | |||
2000 census
As of the 2000 United States Census,[13] there were 10,016 people, 3,683 households, and 2,618 families in the county. The population density was 9 people per square mile (4/km2). There were 4,734 housing units at an average density of 4 per square mile (2/km2). The racial makeup of the county was 68.29% White, 0.10% Black or African American, 29.86% Native American, 0.21% Asian, 0.03% from other races, and 1.51% from two or more races. 0.63% of the population were Hispanic or Latino of any race.
There were 3,683 households, out of which 33.80% had children under the age of 18 living with them, 53.50% were married couples living together, 11.80% had a female householder with no husband present, and 28.90% were non-families. 26.80% of all households were made up of individuals, and 12.40% had someone living alone who was 65 years of age or older. The average household size was 2.66 and the average family size was 3.22.
The county population contained 30.00% under the age of 18, 7.20% from 18 to 24, 23.60% from 25 to 44, 22.20% from 45 to 64, and 17.00% who were 65 years of age or older. The median age was 37 years. For every 100 females there were 98.80 males. For every 100 females age 18 and over, there were 98.20 males.
The median income for a household in the county was $28,322, and the median income for a family was $33,361. Males had a median income of $25,516 versus $19,464 for females. The per capita income for the county was $13,428. About 16.60% of families and 22.10% of the population were below the poverty line, including 30.10% of those under age 18 and 17.40% of those age 65 or over.
2010 census
As of the 2010 United States Census, there were 10,149 people, 3,823 households, and 2,655 families residing in the county.[14] The population density was 9.2 inhabitants per square mile (3.6/km2). There were 4,905 housing units at an average density of 4.5 per square mile (1.7/km2).[15] The racial makeup of the county was 61.7% white, 34.5% American Indian, 0.2% Asian, 0.1% black or African American, 0.4% from other races, and 3.0% from two or more races. Those of Hispanic or Latino origin made up 1.2% of the population.[14] In terms of ancestry, 31.3% were German, 19.2% were Norwegian, 6.3% were Irish, and 3.8% were American.[16]
Of the 3,823 households, 34.4% had children under the age of 18 living with them, 49.1% were married couples living together, 13.4% had a female householder with no husband present, 30.6% were non-families, and 27.3% of all households were made up of individuals. The average household size was 2.58 and the average family size was 3.11. The median age was 39.5 years.[14]
The median income for a household in the county was $37,708 and the median income for a family was $46,146. Males had a median income of $34,080 versus $28,423 for females. The per capita income for the county was $19,825. About 14.3% of families and 20.0% of the population were below the poverty line, including 33.9% of those under age 18 and 11.0% of those age 65 or over.[17]
Communities
Census-designated places
Townships
- Agency
- Alto
- Becker
- Bossko
- Bryant
- Dry Wood Lake
- Easter
- Enterprise
- Garfield
- Geneseo
- Goodwill
- Grant
- Harmon
- Hart
- Lake
- Lawrence
- Lee
- Lien
- Lockwood
- Long Hollow
- Minnesota
- Norway
- One Road
- Rosholt
- Ortley
- Sisseton
- Springdale
- Spring Grove
- Summit
- Victor
- White Rock
Notable people
- Sleepy Eye, Sisseton Sioux chief
- Gene Okerlund, wrestling announcer
Politics
Roberts County is politically a swing county.
| Year | Republican | Democratic | Third parties |
|---|---|---|---|
| 2016 | 55.1% 2,144 | 39.6% 1,540 | 5.3% 205 |
| 2012 | 44.2% 1,883 | 54.1% 2,302 | 1.7% 71 |
| 2008 | 39.3% 1,781 | 58.9% 2,672 | 1.8% 83 |
| 2004 | 48.1% 2,396 | 50.7% 2,527 | 1.2% 59 |
| 2000 | 54.9% 2,237 | 41.7% 1,700 | 3.4% 137 |
| 1996 | 38.0% 1,646 | 50.5% 2,186 | 11.6% 501 |
| 1992 | 34.9% 1,437 | 41.6% 1,716 | 23.5% 968 |
| 1988 | 46.7% 2,012 | 52.6% 2,267 | 0.7% 32 |
| 1984 | 57.2% 2,767 | 42.6% 2,063 | 0.2% 10 |
| 1980 | 58.0% 2,904 | 36.5% 1,829 | 5.5% 276 |
| 1976 | 39.7% 1,915 | 60.0% 2,890 | 0.3% 15 |
| 1972 | 42.3% 2,187 | 57.5% 2,976 | 0.2% 9 |
| 1968 | 42.7% 2,225 | 50.9% 2,651 | 6.5% 337 |
| 1964 | 35.1% 1,931 | 64.9% 3,567 | |
| 1960 | 48.1% 2,857 | 52.0% 3,089 | |
| 1956 | 46.8% 2,854 | 53.2% 3,246 | |
| 1952 | 58.6% 3,566 | 41.4% 2,524 | |
| 1948 | 39.1% 2,211 | 58.0% 3,277 | 2.9% 164 |
| 1944 | 47.4% 2,721 | 52.6% 3,024 | |
| 1940 | 48.3% 3,504 | 51.7% 3,750 | |
| 1936 | 32.5% 1,934 | 64.2% 3,820 | 3.3% 197 |
| 1932 | 21.7% 1,381 | 69.7% 4,440 | 8.6% 547 |
| 1928 | 52.7% 2,966 | 46.6% 2,619 | 0.7% 40 |
| 1924 | 41.0% 1,744 | 5.1% 215 | 54.0% 2,296 |
| 1920 | 49.7% 2,335 | 9.5% 447 | 40.8% 1,913 |
| 1916 | 47.2% 1,259 | 44.6% 1,191 | 8.2% 219 |
| 1912 | 0.0% 0 | 33.0% 812 | 67.0% 1,647 |
| 1908 | 61.0% 1,562 | 30.4% 777 | 8.6% 221 |
| 1904 | 75.0% 2,282 | 19.2% 584 | 5.8% 176 |
| 1900 | 62.1% 1,875 | 35.3% 1,067 | 2.6% 77 |
| 1896 | 58.2% 1,324 | 40.8% 929 | 1.0% 22 |
| 1892 | 62.9% 538 | 7.9% 68 | 29.2% 250 |
External links
References
- Legislative Manual, South Dakota, 2005, p. 597
- "State & County QuickFacts". United States Census Bureau. Retrieved November 28, 2013.
- "Find a County". National Association of Counties. Retrieved June 7, 2011.
- South Dakota County Histories/Roberts County (accessed February 8, 2019)
- Roberts County SD Google Maps (accessed 8 February 2019)
- ""Find an Altitude" Google Maps (accessed February 8, 2019)". Archived from the original on May 21, 2019. Retrieved February 8, 2019.
- "2010 Census Gazetteer Files". US Census Bureau. August 22, 2012. Retrieved March 28, 2015.
- "Annual Estimates of the Resident Population for Counties: April 1, 2010 to July 1, 2019". Retrieved April 10, 2020.
- "US Decennial Census". US Census Bureau. Retrieved March 28, 2015.
- "Historical Census Browser". University of Virginia Library. Retrieved March 28, 2015.
- Forstall, Richard L., ed. (March 27, 1995). "Population of Counties by Decennial Census: 1900 to 1990". US Census Bureau. Retrieved March 28, 2015.
- "Census 2000 PHC-T-4. Ranking Tables for Counties: 1990 and 2000" (PDF). US Census Bureau. April 2, 2001. Retrieved March 28, 2015.
- "U.S. Census website". US Census Bureau. Retrieved May 14, 2011.
- "Profile of General Population and Housing Characteristics: 2010 Demographic Profile Data". US Census Bureau. Archived from the original on February 13, 2020. Retrieved March 12, 2016.
- "Population, Housing Units, Area, and Density: 2010 - County". US Census Bureau. Archived from the original on February 13, 2020. Retrieved March 12, 2016.
- "Selected Social Characteristics in the US – 2006-2010 American Community Survey 5-Year Estimates". US Census Bureau. Archived from the original on February 13, 2020. Retrieved March 12, 2016.
- "Selected Economic Characteristics – 2006-2010 American Community Survey 5-Year Estimates". US Census Bureau. Archived from the original on February 13, 2020. Retrieved March 12, 2016.
- Leip, David. "Atlas of US Presidential Elections". uselectionatlas.org. Retrieved September 16, 2018.
Places adjacent to Roberts County, South Dakota | ||||||||||
|---|---|---|---|---|---|---|---|---|---|---|
| ||||||||||
Municipalities and communities of Roberts County, South Dakota, United States | ||
|---|---|---|
| Cities | | |
| Towns | ||
| CDPs | ||
| Townships | ||
| Unincorporated community | ||
| Indian reservation | ||
| Footnotes | ‡This populated place also has portions in an adjacent county or counties | |
| ||

| Authority control |
|---|