Davison County, South Dakota
Davison County is a county in the U.S. state of South Dakota. As of the 2010 United States Census, the population was 19,504.[1] Its county seat is Mitchell.[2] The county was created in 1873 and organized in 1874.[3] It was named for Henry C. Davison, the first settler in the county.[4]
Davison County | |
|---|---|
.jpg.webp) Davison County Courthouse in Mitchell | |
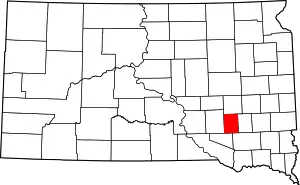 Location within the U.S. state of South Dakota | |
 South Dakota's location within the U.S. | |
| Coordinates: 43°41′N 98°10′W | |
| Country | |
| State | |
| Founded | 1873 (created) 1874 (organized) |
| Seat | Mitchell |
| Largest city | Mitchell |
| Area | |
| • Total | 437 sq mi (1,130 km2) |
| • Land | 436 sq mi (1,130 km2) |
| • Water | 1.4 sq mi (4 km2) 0.3% |
| Population (2010) | |
| • Total | 19,504 |
| • Estimate (2018) | 19,790 |
| • Density | 45/sq mi (17/km2) |
| Time zone | UTC−6 (Central) |
| • Summer (DST) | UTC−5 (CDT) |
| Congressional district | At-large |
| Website | www |
Davison County is part of the Mitchell, SD Micropolitan Statistical Area.
History
The area's first settlement occurred in 1871 in "Firesteel Creek"; the settlers were Herman Cady Greene and John Head. Greene brought lumber from Yankton in 1872 and built a frame house. The small community which grew around this house was called Firesteel. It became part of a county created by the territorial legislature in 1873.
In 1881 the territorial legislature met and considered two bills redefining the boundaries of Hanson and Davison Counties. They considered adjusting the two counties' boundaries by either combining the two, or changing their method of separation. A public vote determined to add four townships to the west, and split the two previous counties down the middle.
The settlement originally called "Arlandton" was renamed "Mount Vernon" in 1882; by 1883 it boasted a hardware store, a livery stable, lumber yard, drugstore, cigar maker, and a hotel.[5]
During the latter part of the nineteenth century the county was served by railroad spur lines.[6] By the mid-twentieth century, those lines had been abandoned and removed.[7]
Geography
The terrain of Davison County consists of rolling hills. Its area is largely devoted to agriculture. The James River flows south-southeastward through the NE portion of the county. A local drainage flows eastward through the upper quarter of the county, terminating in Lake Mitchell, north of the city of Mitchell.[7] The terrain slopes to the east, and rises toward its SW corner. Its highest point is on the western portion of its southern border, at 1,667' (508m) ASL.[8]
The county has a total area of 437 square miles (1,130 km2), of which 436 square miles (1,130 km2) is land and 1.4 square miles (3.6 km2) (0.3%) is water.[9] It is the fourth-smallest county in South Dakota by area.
Major highways
Adjacent counties
- Sanborn County - north
- Hanson County - east
- Hutchinson County - southeast
- Douglas County - southwest
- Aurora County - west
Demographics
| Historical population | |||
|---|---|---|---|
| Census | Pop. | %± | |
| 1880 | 1,256 | — | |
| 1890 | 5,449 | 333.8% | |
| 1900 | 7,483 | 37.3% | |
| 1910 | 11,625 | 55.4% | |
| 1920 | 14,139 | 21.6% | |
| 1930 | 16,821 | 19.0% | |
| 1940 | 15,336 | −8.8% | |
| 1950 | 16,522 | 7.7% | |
| 1960 | 16,681 | 1.0% | |
| 1970 | 17,319 | 3.8% | |
| 1980 | 17,820 | 2.9% | |
| 1990 | 17,503 | −1.8% | |
| 2000 | 18,741 | 7.1% | |
| 2010 | 19,504 | 4.1% | |
| 2019 (est.) | 19,775 | [10] | 1.4% |
| US Decennial Census[11] 1790-1960[12] 1900-1990[13] 1990-2000[14] 2010-2018[1] | |||
2000 census
As of the 2000 United States Census,[15] there were 18,741 people, 7,585 households, and 4,770 families in the county. The population density was 43 people per square mile (17/km2). There were 8,093 housing units at an average density of 19 per square mile (7/km2). The racial makeup of the county was 96.23% White, 0.27% Black or African American, 1.98% Native American, 0.43% Asian, 0.02% Pacific Islander, 0.30% from other races, and 0.77% from two or more races. 0.69% of the population were Hispanic or Latino of any race. 50.8% were of German, 10.1% Norwegian, 5.5% Irish and 5.4% American ancestry.
There were 7,585 households, out of which 31.10% had children under the age of 18 living with them, 51.40% were married couples living together, 8.20% had a female householder with no husband present, and 37.10% were non-families. 30.80% of all households were made up of individuals, and 13.40% had someone living alone who was 65 years of age or older. The average household size was 2.38 and the average family size was 3.00.
The county population had 25.40% under the age of 18, 12.00% from 18 to 24, 25.90% from 25 to 44, 20.40% from 45 to 64, and 16.20% who were 65 years of age or older. The median age was 36 years. For every 100 females, there were 94.10 males. For every 100 females age 18 and over, there were 91.80 males.
The median income for a household in the county was $33,476, and the median income for a family was $44,357. Males had a median income of $30,825 versus $20,940 for females. The per capita income for the county was $17,879. About 8.20% of families and 11.50% of the population were below the poverty line, including 11.30% of those under age 18 and 10.40% of those age 65 or over.
2010 census
As of the 2010 United States Census, there were 19,504 people, 8,296 households, and 4,892 families in the county.[16] The population density was 44.8 inhabitants per square mile (17.3/km2). There were 8,852 housing units at an average density of 20.3 per square mile (7.8/km2).[17] The racial makeup of the county was 94.4% white, 2.5% American Indian, 0.5% Asian, 0.4% black or African American, 0.1% Pacific islander, 0.5% from other races, and 1.6% from two or more races. Those of Hispanic or Latino origin made up 1.5% of the population.[16] In terms of ancestry, 51.8% were German, 10.6% were Norwegian, 10.1% were Irish, 7.4% were English, 6.0% were Dutch, and 4.5% were American.[18]
Of the 8,296 households, 28.1% had children under the age of 18 living with them, 46.6% were married couples living together, 8.5% had a female householder with no husband present, 41.0% were non-families, and 34.3% of all households were made up of individuals. The average household size was 2.26 and the average family size was 2.91. The median age was 37.8 years.[16]
The median income for a household in the county was $41,867 and the median income for a family was $54,677. Males had a median income of $37,688 versus $26,223 for females. The per capita income for the county was $22,794. About 6.9% of families and 13.8% of the population were below the poverty line, including 12.1% of those under age 18 and 10.4% of those age 65 or over.[19]
Communities
Cities
- Mitchell (county seat)
- Mount Vernon
Town
Census-designated place
Townships
- Badger Township
- Baker Township
- Beulah Township
- Blenden Township
- Tobin Township
- Lisbon Township
- Mitchell Township
- Mount Vernon Township
- Perry Township
- Prosper Township
- Rome Township
- Union Township
Politics
Davison County voters tend to vote Republican; in 71% of the national elections since 1948, the county has selected the Republican Party candidate.
| Year | Republican | Democratic | Third parties |
|---|---|---|---|
| 2020 | 66.4% 5,613 | 31.3% 2,648 | 2.3% 193 |
| 2016 | 64.9% 5,157 | 29.6% 2,355 | 5.5% 440 |
| 2012 | 59.7% 4,757 | 38.2% 3,042 | 2.2% 172 |
| 2008 | 56.0% 4,731 | 42.0% 3,554 | 2.0% 170 |
| 2004 | 62.1% 5,561 | 36.5% 3,263 | 1.4% 128 |
| 2000 | 59.1% 4,445 | 39.0% 2,936 | 2.0% 147 |
| 1996 | 44.8% 3,371 | 44.7% 3,364 | 10.5% 793 |
| 1992 | 38.2% 3,111 | 40.3% 3,285 | 21.5% 1,750 |
| 1988 | 51.7% 4,024 | 47.6% 3,705 | 0.7% 57 |
| 1984 | 59.4% 4,783 | 40.4% 3,248 | 0.2% 17 |
| 1980 | 55.7% 4,743 | 36.5% 3,107 | 7.8% 662 |
| 1976 | 44.7% 3,688 | 54.7% 4,510 | 0.6% 50 |
| 1972 | 44.5% 3,796 | 55.2% 4,710 | 0.3% 25 |
| 1968 | 50.1% 3,869 | 46.4% 3,585 | 3.4% 265 |
| 1964 | 36.5% 2,789 | 63.5% 4,861 | |
| 1960 | 50.0% 4,105 | 50.0% 4,108 | |
| 1956 | 51.6% 4,056 | 48.4% 3,809 | |
| 1952 | 59.7% 4,774 | 40.3% 3,227 | |
| 1948 | 42.0% 2,996 | 57.0% 4,064 | 1.0% 68 |
| 1944 | 47.6% 2,929 | 52.4% 3,222 | |
| 1940 | 46.4% 3,659 | 53.6% 4,230 | |
| 1936 | 32.2% 2,510 | 63.8% 4,983 | 4.0% 312 |
| 1932 | 28.7% 2,147 | 70.0% 5,233 | 1.3% 100 |
| 1928 | 58.2% 3,821 | 41.5% 2,729 | 0.3% 21 |
| 1924 | 51.7% 2,801 | 10.7% 578 | 37.6% 2,038 |
| 1920 | 54.2% 2,605 | 23.0% 1,105 | 22.9% 1,100 |
| 1916 | 50.5% 1,516 | 45.8% 1,374 | 3.8% 113 |
| 1912 | 0.0% 0 | 45.3% 1,266 | 54.7% 1,530 |
| 1908 | 50.9% 1,276 | 43.1% 1,081 | 6.0% 149 |
| 1904 | 68.8% 1,626 | 21.4% 506 | 9.7% 230 |
| 1900 | 50.3% 853 | 46.1% 782 | 3.7% 62 |
| 1896 | 45.1% 616 | 53.7% 733 | 1.2% 16 |
| 1892 | 42.8% 569 | 9.0% 120 | 48.2% 640 |
References
- "State & County QuickFacts". US Census Bureau. Archived from the original on July 28, 2011. Retrieved November 25, 2013.
- "Find a County". National Association of Counties. Archived from the original on 31 May 2011. Retrieved 7 June 2011.
- "Dakota Territory, South Dakota, and North Dakota: Individual County Chronologies". Dakota Territory Atlas of Historical County Boundaries. The Newberry Library. 2006. Retrieved March 29, 2015.
- Gannett, Henry (1905). The Origin of Certain Place Names in the United States. Govt. Print. Off. p. 101.
- A Brief History of Davison County (accessed February 1, 2019)
- American Rails/South Dakota (accessed February 1, 2019)
- Davison County SD Google Maps (accessed 1 February 2019)
- ""Find an Altitude" Google Maps (accessed February 1, 2019)". Archived from the original on May 21, 2019. Retrieved February 2, 2019.
- "2010 Census Gazetteer Files". US Census Bureau. August 22, 2012. Retrieved March 24, 2015.
- "Annual Estimates of the Resident Population for Counties: April 1, 2010 to July 1, 2019". Retrieved April 10, 2020.
- "US Decennial Census". US Census Bureau. Retrieved March 24, 2015.
- "Historical Census Browser". University of Virginia Library. Retrieved March 24, 2015.
- Forstall, Richard L., ed. (March 27, 1995). "Population of Counties by Decennial Census: 1900 to 1990". US Census Bureau. Retrieved March 24, 2015.
- "Census 2000 PHC-T-4. Ranking Tables for Counties: 1990 and 2000" (PDF). US Census Bureau. April 2, 2001. Retrieved March 24, 2015.
- "U.S. Census website". US Census Bureau. Retrieved May 14, 2011.
- "Profile of General Population and Housing Characteristics: 2010 Demographic Profile Data". US Census Bureau. Archived from the original on 13 February 2020. Retrieved 11 March 2016.
- "Population, Housing Units, Area, and Density: 2010 - County". US Census Bureau. Archived from the original on 13 February 2020. Retrieved 11 March 2016.
- "Selected Social Characteristics in the US – 2006-2010 American Community Survey 5-Year Estimates". US Census Bureau. Archived from the original on 13 February 2020. Retrieved 11 March 2016.
- "Selected Economic Characteristics – 2006-2010 American Community Survey 5-Year Estimates". US Census Bureau. Archived from the original on 13 February 2020. Retrieved 11 March 2016.
- Leip, David. "Atlas of US Presidential Elections". uselectionatlas.org. Retrieved 15 April 2018.
External links
Places adjacent to Davison County, South Dakota | ||||||||||
|---|---|---|---|---|---|---|---|---|---|---|
| ||||||||||
Municipalities and communities of Davison County, South Dakota, United States | ||
|---|---|---|
| City | | |
| Town | ||
| CDP | ||
| ||

| Authority control |
|---|