Hand County, South Dakota
Hand County is a county in the U.S. state of South Dakota. As of the 2010 United States Census, the population was 3,431.[1] Its county seat is Miller.[2]
Hand County | |
|---|---|
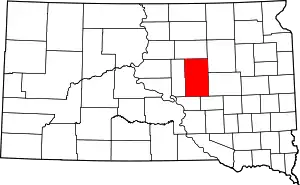 Location within the U.S. state of South Dakota | |
 South Dakota's location within the U.S. | |
| Coordinates: 44°33′N 99°00′W | |
| Country | |
| State | |
| Founded | 1873 (created) 1882 (redrawn) 1882 (organized) |
| Named for | George A. Hand |
| Seat | Miller |
| Largest city | Miller |
| Area | |
| • Total | 1,440 sq mi (3,700 km2) |
| • Land | 1,437 sq mi (3,720 km2) |
| • Water | 3.6 sq mi (9 km2) 0.2% |
| Population (2010) | |
| • Total | 3,431 |
| • Estimate (2018) | 3,262 |
| • Density | 2.4/sq mi (0.92/km2) |
| Time zone | UTC−6 (Central) |
| • Summer (DST) | UTC−5 (CDT) |
| Congressional district | At-large |
| Website | hand |
History
.png.webp)
Hand County was named for George A. Hand, territorial secretary.[3] It was created in 1873 by the Dakota territorial legislature. The boundaries were finalized in 1882, the year it was organized.[4]
Geography
The terrain of Hand County consists of rolling hills, dotted with infrequent ponds and small lakes. Most of the area is devoted to agriculture.[5] The terrain slopes to the east and northeast; its highest point is on the lower part of the county's west boundary line, at 2,080' (634m) ASL.[6] The county contains a total area of 1,440 square miles (3,700 km2), of which 1,437 square miles (3,720 km2) is land and 3.6 square miles (9.3 km2) (0.2%) is water.[7]
Adjacent counties
- Faulk County - north
- Spink County - northeast
- Beadle County - east
- Jerauld County - southeast
- Buffalo County - southwest
- Hyde County - west
Protected areas[5]
- Collins State Game Production Area
- Dakota State Game Production Area
- East Pearl State Game Production Area
- Hawkins State Game Production Area
- Lake Jones State Game Production Area
- Lake Louise State Game Production Area
- Lake Louise State Recreation Area
- Lechtenberg State Game Production Area
- Reinhardt State Game Production Area
- Rosehill State Game Production Area
- Spring Lake State Game Production Area
- West Pearl State Game Production Area
Lakes[5]
- Costigan Slough Lake
- Jones Lake
- Lake Louise
- Matter Lake
- Spring Lake
- Wall Lake
Demographics
| Historical population | |||
|---|---|---|---|
| Census | Pop. | %± | |
| 1880 | 153 | — | |
| 1890 | 6,346 | 4,047.7% | |
| 1900 | 4,525 | −28.7% | |
| 1910 | 7,870 | 73.9% | |
| 1920 | 8,778 | 11.5% | |
| 1930 | 9,485 | 8.1% | |
| 1940 | 7,166 | −24.4% | |
| 1950 | 7,149 | −0.2% | |
| 1960 | 6,712 | −6.1% | |
| 1970 | 5,883 | −12.4% | |
| 1980 | 4,948 | −15.9% | |
| 1990 | 4,272 | −13.7% | |
| 2000 | 3,741 | −12.4% | |
| 2010 | 3,431 | −8.3% | |
| 2019 (est.) | 3,191 | [8] | −7.0% |
| US Decennial Census[9] 1790-1960[10] 1900-1990[11] 1990-2000[12] 2010-2018[1] | |||
2000 census
As of the 2000 United States Census,[13] there were 3,741 people, 1,543 households, and 1,050 families in the county. The population density was 3 people per square mile (1/km2). There were 1,840 housing units at an average density of 1.3 per square mile (0.5/km2). The racial makeup of the county was 99.30% White, 0.03% Black or African American, 0.13% Native American, 0.08% Asian, 0.13% from other races, and 0.32% from two or more races. 0.29% of the population were Hispanic or Latino of any race.
There were 1,543 households, out of which 28.10% had children under the age of 18 living with them, 60.90% were married couples living together, 4.40% had a female householder with no husband present, and 31.90% were non-families. 30.20% of all households were made up of individuals, and 17.40% had someone living alone who was 65 years of age or older. The average household size was 2.38 and the average family size was 2.97.
The county population contained 24.60% under the age of 18, 5.10% from 18 to 24, 22.30% from 25 to 44, 23.80% from 45 to 64, and 24.20% who were 65 years of age or older. The median age was 44 years. For every 100 females there were 96.20 males. For every 100 females age 18 and over, there were 92.90 males.
The median income for a household in the county was $32,377, and the median income for a family was $38,017. Males had a median income of $26,335 versus $16,181 for females. The per capita income for the county was $18,735. About 6.10% of families and 9.20% of the population were below the poverty line, including 8.90% of those under age 18 and 10.50% of those age 65 or over.
2010 census
As of the 2010 United States Census, there were 3,431 people, 1,494 households, and 972 families residing in the county.[14] The population density was 2.4 inhabitants per square mile (0.93/km2). There were 1,815 housing units at an average density of 1.3 per square mile (0.50/km2).[15] The racial makeup of the county was 98.4% white, 0.3% Asian, 0.2% American Indian, 0.1% black or African American, 0.2% from other races, and 0.8% from two or more races. Those of Hispanic or Latino origin made up 0.6% of the population.[14] In terms of ancestry, 57.3% were German, 15.3% were Irish, 9.0% were Norwegian, 8.1% were English, 6.1% were Dutch, and 3.4% were American.[16]
Of the 1,494 households, 23.8% had children under the age of 18 living with them, 56.6% were married couples living together, 5.3% had a female householder with no husband present, 34.9% were non-families, and 32.2% of all households were made up of individuals. The average household size was 2.26 and the average family size was 2.84. The median age was 48.2 years.[14]
The median income for a household in the county was $45,895 and the median income for a family was $52,407. Males had a median income of $40,725 versus $24,844 for females. The per capita income for the county was $23,238. About 11.4% of families and 13.1% of the population were below the poverty line, including 18.9% of those under age 18 and 16.5% of those age 65 or over.[17]
Communities
Incorporated communities
- Miller (county seat)
- Ree Heights
- St. Lawrence
- Wessington (partial)
Townships
- Alden
- Alpha
- Bates
- Burdette
- Campbell
- Carlton
- Cedar
- Como
- Florence
- Gilbert
- Glendale
- Grand
- Greenleaf
- Hiland
- Holden
- Hulbert
- Linn
- Logan
- Midland
- Miller
- Mondamin
- Ohio
- Ontario
- Park
- Pearl
- Plato
- Pleasant Valley
- Ree Heights
- Riverside
- Rockdale
- Rose Hill
- St. Lawrence
- Spring Hill
- Spring Lake
- Wheaton
- York
Unorganized territory
The county contains one area of unorganized territory: Northwest Hand.
Politics
Hand County voters have voted Republican for many decades. In only one national election since 1936 has the county selected the Democratic Party candidate.
| Year | Republican | Democratic | Third parties |
|---|---|---|---|
| 2016 | 76.5% 1,391 | 18.4% 334 | 5.1% 93 |
| 2012 | 67.2% 1,242 | 31.1% 575 | 1.7% 31 |
| 2008 | 62.0% 1,247 | 35.7% 718 | 2.3% 46 |
| 2004 | 67.8% 1,482 | 30.5% 668 | 1.7% 37 |
| 2000 | 69.9% 1,419 | 27.8% 565 | 2.3% 47 |
| 1996 | 52.3% 1,187 | 35.4% 803 | 12.3% 278 |
| 1992 | 44.4% 1,130 | 30.8% 785 | 24.8% 631 |
| 1988 | 56.7% 1,461 | 42.7% 1,101 | 0.6% 16 |
| 1984 | 70.3% 2,030 | 29.3% 846 | 0.4% 10 |
| 1980 | 67.4% 2,066 | 26.2% 803 | 6.4% 197 |
| 1976 | 50.4% 1,510 | 49.3% 1,477 | 0.2% 7 |
| 1972 | 57.9% 1,806 | 41.9% 1,307 | 0.2% 6 |
| 1968 | 54.8% 1,650 | 37.7% 1,136 | 7.5% 226 |
| 1964 | 48.4% 1,466 | 51.6% 1,563 | |
| 1960 | 57.3% 1,872 | 42.7% 1,397 | |
| 1956 | 55.4% 1,804 | 44.6% 1,453 | |
| 1952 | 70.7% 2,262 | 29.3% 937 | |
| 1948 | 50.5% 1,402 | 49.2% 1,367 | 0.3% 9 |
| 1944 | 57.6% 1,558 | 42.4% 1,146 | |
| 1940 | 55.5% 2,002 | 44.5% 1,608 | |
| 1936 | 39.8% 1,289 | 53.2% 1,721 | 7.0% 227 |
| 1932 | 34.0% 1,394 | 64.8% 2,658 | 1.3% 53 |
| 1928 | 63.3% 2,430 | 36.4% 1,397 | 0.4% 14 |
| 1924 | 54.0% 1,727 | 21.6% 690 | 24.4% 781 |
| 1920 | 61.1% 1,511 | 26.5% 655 | 12.5% 308 |
| 1916 | 45.0% 801 | 50.8% 905 | 4.3% 76 |
| 1912 | 0.0% 0 | 48.7% 826 | 51.3% 869 |
| 1908 | 51.6% 851 | 39.7% 655 | 8.7% 144 |
| 1904 | 67.5% 943 | 12.2% 170 | 20.3% 284 |
| 1900 | 49.1% 592 | 49.2% 594 | 1.7% 21 |
| 1896 | 44.0% 451 | 55.3% 567 | 0.8% 8 |
| 1892 | 44.5% 526 | 5.9% 70 | 49.6% 587 |
See also
References
| Wikimedia Commons has media related to Hand County, South Dakota. |
- "State & County QuickFacts". United States Census Bureau. Archived from the original on June 7, 2011. Retrieved November 25, 2013.
- "Find a County". National Association of Counties. Retrieved June 7, 2011.
- Gannett, Henry (1905). The Origin of Certain Place Names in the United States. Govt. Print. Off. p. 148.
- "Dakota Territory, South Dakota, and North Dakota: Individual County Chronologies". Dakota Territory Atlas of Historical County Boundaries. The Newberry Library. 2006. Retrieved March 29, 2015.
- Hand County SD Google Maps (accessed 3 February 2019)
- ""Find an Altitude" Google Maps (accessed February 3, 2019)". Archived from the original on May 21, 2019. Retrieved February 4, 2019.
- "2010 Census Gazetteer Files". US Census Bureau. August 22, 2012. Retrieved March 26, 2015.
- "Annual Estimates of the Resident Population for Counties: April 1, 2010 to July 1, 2019". Retrieved April 10, 2020.
- "US Decennial Census". US Census Bureau. Retrieved March 26, 2015.
- "Historical Census Browser". University of Virginia Library. Retrieved March 26, 2015.
- Forstall, Richard L., ed. (March 27, 1995). "Population of Counties by Decennial Census: 1900 to 1990". US Census Bureau. Retrieved March 26, 2015.
- "Census 2000 PHC-T-4. Ranking Tables for Counties: 1990 and 2000" (PDF). US Census Bureau. April 2, 2001. Retrieved March 26, 2015.
- "U.S. Census website". US Census Bureau. Retrieved May 14, 2011.
- "Profile of General Population and Housing Characteristics: 2010 Demographic Profile Data". US Census Bureau. Archived from the original on 13 February 2020. Retrieved 12 March 2016.
- "Population, Housing Units, Area, and Density: 2010 - County". US Census Bureau. Archived from the original on 13 February 2020. Retrieved 12 March 2016.
- "Selected Social Characteristics in the US – 2006-2010 American Community Survey 5-Year Estimates". US Census Bureau. Archived from the original on 13 February 2020. Retrieved 12 March 2016.
- "Selected Economic Characteristics – 2006-2010 American Community Survey 5-Year Estimates". U.S. Census Bureau. Archived from the original on February 13, 2020. Retrieved March 12, 2016.
- Leip, David. "Atlas of US Presidential Elections". uselectionatlas.org. Retrieved April 15, 2018.
Places adjacent to Hand County, South Dakota | ||||||||||
|---|---|---|---|---|---|---|---|---|---|---|
| ||||||||||
Municipalities and communities of Hand County, South Dakota, United States | ||
|---|---|---|
| Cities | | |
| Towns | ||
| Townships | ||
| Unincorporated community | ||
| Footnotes | ‡This populated place also has portions in an adjacent county or counties | |
| ||
