Walworth County, South Dakota
Walworth County is a county in the U.S. state of South Dakota. As of the 2010 census, the population was 5,438.[1] Its county seat is Selby.[2] The county was created in 1873 and organized in 1883.[3] It is named for Walworth County, Wisconsin.[4]
Walworth County | |
|---|---|
%252C_Selby%252C_South_Dakota_(29360818481).jpg.webp) | |
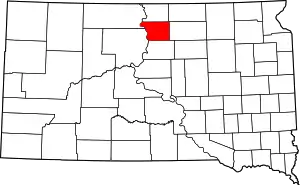 Location within the U.S. state of South Dakota | |
 South Dakota's location within the U.S. | |
| Coordinates: 45°26′N 100°02′W | |
| Country | |
| State | |
| Founded | 1873 (created) 1883 (organized) |
| Named for | Walworth County, Wisconsin |
| Seat | Selby |
| Largest city | Mobridge |
| Area | |
| • Total | 745 sq mi (1,930 km2) |
| • Land | 709 sq mi (1,840 km2) |
| • Water | 36 sq mi (90 km2) 4.8% |
| Population (2010) | |
| • Total | 5,438 |
| • Estimate (2018) | 5,587 |
| • Density | 7.3/sq mi (2.8/km2) |
| Time zone | UTC−6 (Central) |
| • Summer (DST) | UTC−5 (CDT) |
| Congressional district | At-large |
| Website | walworthco |
Geography
The Missouri River flows southward along the county's west boundary line. Swan Creek flows west-northwest through the county's SW corner, discharging into the Missouri. The county's terrain consists of semi-arid rolling hills, carved by drainages and gullies. Most of the area is devoted to agriculture.[5] The terrain slopes to the south and east, although the western portion of the county drops westward into the Missouri River valley. The county's highest point is on the eastern portion of its north boundary line, at 1,982' (604m) ASL.[6] The county has a total area of 745 square miles (1,930 km2), of which 709 square miles (1,840 km2) is land and 36 square miles (93 km2) (4.8%) is water.[7]
The eastern portion of South Dakota's counties (48 of 66) observe Central Time; the western counties (18 of 66) observe Mountain Time. Walworth County is the westernmost of the SD counties to observe Central Time.[8]
Major highways
 U.S. Highway 12
 U.S. Highway 83
 South Dakota Highway 20
 South Dakota Highway 47
 South Dakota Highway 130
 South Dakota Highway 144
 South Dakota Highway 271
 South Dakota Highway 1804
Adjacent counties
- Campbell County - north
- McPherson County - northeast
- Edmunds County - east
- Potter County - south
- Dewey County - southwest (observes Mountain Time)
- Corson County - northwest (observes Mountain Time)
Protected areas[5]
- Blue Blanket Lake State Game Production Area
- Bowdle Beach State Lakeside Use Area
- Indian Creek State Recreation Area
- Lake Hiddenwood State Recreation Area
- LeBeau State Lakeside Use Area
- Oahe Blue Blanket State Game Production Area
- Revheim Bay Recreation Area
- Spring Lake State Game Production Area
- Swan Creek State Game Production Area
- Swan Creek State Recreation Area
- Swan Lake State Game Production Area
- Thomas Bay State Lakeside Use Area
- Walth Bay State Game Production Area
- Walth Bay State Lakeside Use Area
Demographics
| Historical population | |||
|---|---|---|---|
| Census | Pop. | %± | |
| 1880 | 46 | — | |
| 1890 | 2,153 | 4,580.4% | |
| 1900 | 3,839 | 78.3% | |
| 1910 | 6,488 | 69.0% | |
| 1920 | 8,447 | 30.2% | |
| 1930 | 8,791 | 4.1% | |
| 1940 | 7,274 | −17.3% | |
| 1950 | 7,648 | 5.1% | |
| 1960 | 8,097 | 5.9% | |
| 1970 | 7,842 | −3.1% | |
| 1980 | 7,011 | −10.6% | |
| 1990 | 6,087 | −13.2% | |
| 2000 | 5,974 | −1.9% | |
| 2010 | 5,438 | −9.0% | |
| 2019 (est.) | 5,435 | [9] | −0.1% |
| US Decennial Census[10] 1790-1960[11] 1900-1990[12] 1990-2000[13] 2010-2018[1] | |||
2000 census
As of the 2000 United States Census,[14] there were 5,974 people, 2,506 households, and 1,643 families in the county. The population density was 8 people per square mile (3/km2). There were 3,144 housing units at an average density of 4 per square mile (2/km2). The racial makeup of the county was 86.58% White, 0.03% Black or African American, 11.77% Native American, 0.15% Asian, 0.03% Pacific Islander, 0.07% from other races, and 1.37% from two or more races. 0.60% of the population were Hispanic or Latino of any race.
There were 2,506 households, out of which 26.90% had children under the age of 18 living with them, 53.40% were married couples living together, 8.90% had a female householder with no husband present, and 34.40% were non-families. 31.40% of all households were made up of individuals, and 16.40% had someone living alone who was 65 years of age or older. The average household size was 2.31 and the average family size was 2.89.
The county population contained 24.10% under the age of 18, 6.50% from 18 to 24, 22.40% from 25 to 44, 25.00% from 45 to 64, and 21.90% who were 65 years of age or older. The median age was 43 years. For every 100 females there were 94.20 males. For every 100 females age 18 and over, there were 90.30 males.
The median income for a household in the county was $27,834, and the median income for a family was $33,654. Males had a median income of $23,284 versus $17,902 for females. The per capita income for the county was $15,492. About 14.70% of families and 18.20% of the population were below the poverty line, including 26.00% of those under age 18 and 13.40% of those age 65 or over.
2010 census
As of the 2010 United States Census, there were 5,438 people, 2,392 households, and 1,490 families in the county.[15] The population density was 7.7 inhabitants per square mile (3.0/km2). There were 3,003 housing units at an average density of 4.2 per square mile (1.6/km2).[16] The racial makeup of the county was 82.6% white, 14.3% American Indian, 0.2% Asian, 0.1% black or African American, 0.2% from other races, and 2.6% from two or more races. Those of Hispanic or Latino origin made up 0.7% of the population.[15] In terms of ancestry, 56.9% were German, 12.5% were Norwegian, 8.9% were Russian, 5.4% were Irish, and 3.1% were American.[17]
Of the 2,392 households, 25.9% had children under the age of 18 living with them, 49.2% were married couples living together, 8.9% had a female householder with no husband present, 37.7% were non-families, and 32.8% of all households were made up of individuals. The average household size was 2.21 and the average family size was 2.79. The median age was 47.2 years.[15]
The median income for a household in the county was $39,517 and the median income for a family was $51,250. Males had a median income of $37,857 versus $21,551 for females. The per capita income for the county was $23,716. About 7.5% of families and 14.5% of the population were below the poverty line, including 23.6% of those under age 18 and 14.4% of those age 65 or over.[18]
Politics
Walworth County voters have been reliably Republican for decades. Only three Democratic presidential candidates have ever carried the county: William Jennings Bryan in 1896, Franklin D. Roosevelt in 1932 and 1936, and Lyndon Johnson in 1964.
| Year | Republican | Democratic | Third parties |
|---|---|---|---|
| 2016 | 76.5% 1,896 | 18.5% 457 | 5.0% 124 |
| 2012 | 70.3% 1,731 | 27.3% 671 | 2.4% 60 |
| 2008 | 62.9% 1,668 | 34.8% 923 | 2.2% 59 |
| 2004 | 68.3% 1,967 | 30.5% 878 | 1.2% 35 |
| 2000 | 68.9% 1,758 | 28.2% 721 | 2.9% 74 |
| 1996 | 52.4% 1,461 | 33.7% 939 | 13.9% 389 |
| 1992 | 49.5% 1,439 | 28.5% 829 | 22.0% 640 |
| 1988 | 63.4% 1,940 | 35.8% 1,094 | 0.9% 26 |
| 1984 | 75.0% 2,396 | 24.4% 779 | 0.6% 19 |
| 1980 | 74.6% 2,675 | 21.0% 753 | 4.5% 160 |
| 1976 | 58.7% 2,187 | 40.7% 1,516 | 0.7% 25 |
| 1972 | 65.1% 2,416 | 34.7% 1,287 | 0.2% 8 |
| 1968 | 60.2% 2,204 | 34.8% 1,276 | 5.0% 182 |
| 1964 | 48.7% 1,849 | 51.4% 1,952 | |
| 1960 | 62.1% 2,406 | 37.9% 1,468 | |
| 1956 | 60.2% 2,132 | 39.8% 1,409 | |
| 1952 | 65.2% 2,369 | 34.8% 1,262 | |
| 1948 | 50.9% 1,607 | 48.0% 1,513 | 1.1% 35 |
| 1944 | 55.6% 1,533 | 44.4% 1,222 | |
| 1940 | 55.1% 1,921 | 44.9% 1,565 | |
| 1936 | 38.7% 1,420 | 60.3% 2,212 | 0.9% 34 |
| 1932 | 31.6% 1,049 | 66.9% 2,221 | 1.5% 50 |
| 1928 | 60.0% 1,854 | 39.3% 1,216 | 0.7% 22 |
| 1924 | 44.2% 1,033 | 4.9% 114 | 51.0% 1,193 |
| 1920 | 61.4% 1,411 | 20.8% 478 | 17.8% 409 |
| 1916 | 55.0% 761 | 42.7% 590 | 2.3% 32 |
| 1912 | 40.2% 451 | 59.8% 670 | |
| 1908 | 68.0% 825 | 28.9% 351 | 3.1% 38 |
| 1904 | 76.1% 654 | 20.5% 176 | 3.5% 30 |
| 1900 | 61.9% 478 | 36.5% 282 | 1.6% 12 |
| 1896 | 46.2% 250 | 52.9% 286 | 0.9% 5 |
| 1892 | 44.2% 187 | 10.6% 45 | 45.2% 191 |
References
- "State & County QuickFacts". United States Census Bureau. Retrieved November 28, 2013.
- "Find a County". National Association of Counties. Retrieved June 7, 2011.
- "Dakota Territory, South Dakota, and North Dakota: Individual County Chronologies". Dakota Territory Atlas of Historical County Boundaries. The Newberry Library. 2006. Retrieved March 31, 2015.
- Legislative Manual, South Dakota, 2005, p. 597
- Walworth County SD Google Maps (accessed 9 February 2019)
- ""Find an Altitude" Google Maps (accessed 9 February 2019)". Archived from the original on May 21, 2019. Retrieved February 10, 2019.
- "2010 Census Gazetteer Files". US Census Bureau. August 22, 2012. Retrieved March 28, 2015.
- Map of Time Zone Line through South Dakota (accessed 30 January 2019)
- "Annual Estimates of the Resident Population for Counties: April 1, 2010 to July 1, 2019". Retrieved April 10, 2020.
- "US Decennial Census". US Census Bureau. Retrieved March 28, 2015.
- "Historical Census Browser". University of Virginia Library. Retrieved March 28, 2015.
- Forstall, Richard L., ed. (March 27, 1995). "Population of Counties by Decennial Census: 1900 to 1990". US Census Bureau. Retrieved March 28, 2015.
- "Census 2000 PHC-T-4. Ranking Tables for Counties: 1990 and 2000" (PDF). US Census Bureau. April 2, 2001. Retrieved March 28, 2015.
- "U.S. Census website". US Census Bureau. Retrieved May 14, 2011.
- "Profile of General Population and Housing Characteristics: 2010 Demographic Profile Data". US Census Bureau. Archived from the original on February 13, 2020. Retrieved March 12, 2016.
- "Population, Housing Units, Area, and Density: 2010 - County". US Census Bureau. Archived from the original on February 13, 2020. Retrieved March 12, 2016.
- "Selected Social Characteristics in the US – 2006-2010 American Community Survey 5-Year Estimates". US Census Bureau. Archived from the original on February 13, 2020. Retrieved March 12, 2016.
- "Selected Economic Characteristics – 2006-2010 American Community Survey 5-Year Estimates". US Census Bureau. Archived from the original on February 13, 2020. Retrieved March 12, 2016.
- Leip, David. "Atlas of US Presidential Elections". uselectionatlas.org. Retrieved April 15, 2018.
Places adjacent to Walworth County, South Dakota | ||||||||||
|---|---|---|---|---|---|---|---|---|---|---|
| ||||||||||
Municipalities and communities of Walworth County, South Dakota, United States | ||
|---|---|---|
| Cities | | |
| Towns | ||
| ||

| Authority control |
|---|