Jones County, South Dakota
Jones County is a county in the U.S. state of South Dakota. As of the 2010 census, the population was 1,006,[1] making it the least populous county in South Dakota. Its county seat is Murdo.[2] Created in 1916 and organized in 1917, it is the most recently established county in South Dakota.[3]
Jones County | |
|---|---|
 | |
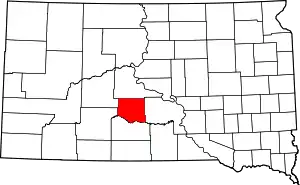 Location within the U.S. state of South Dakota | |
 South Dakota's location within the U.S. | |
| Coordinates: 43°57′N 100°41′W | |
| Country | |
| State | |
| Founded | 1916 (created) January 15, 1917 (organized) |
| Named for | George Wallace Jones |
| Seat | Murdo |
| Largest city | Murdo |
| Area | |
| • Total | 971 sq mi (2,510 km2) |
| • Land | 970 sq mi (2,500 km2) |
| • Water | 1.2 sq mi (3 km2) 0.1% |
| Population (2010) | |
| • Total | 1,006 |
| • Estimate (2018) | 928 |
| • Density | 1.0/sq mi (0.40/km2) |
| Time zone | UTC−6 (Central) |
| • Summer (DST) | UTC−5 (CDT) |
| Congressional district | At-large |
Geography
The terrain of Jones County consists of semi-arid rolling hills, partially devoted to agriculture. The Bad River flows northeasterly through the northwest corner of the county, and the White River forms the county's southern boundary. The southern areas of the county are carved with gullies and drainages flowing to the White River.[4] The terrain generally slopes to the northeast, and its highest point is on the lower western boundary, at 2,444' (745m) ASL.[5] The county has a total area of 971 square miles (2,510 km2), of which 970 square miles (2,500 km2) is land and 1.2 square miles (3.1 km2) (0.1%) is water.[6]
The eastern portion of South Dakota's counties (48 of 66) observe Central Time; the western counties (18 of 66) observe Mountain Time. Jones County is the westernmost of the SD counties to observe Central Time.[7]
Major highways
 Interstate 90
 U.S. Highway 83
Adjacent counties
- Stanley County - north
- Lyman County - east
- Mellette County - south
- Jackson County - southwest (observes Mountain Time)
- Haakon County - northwest (observes Mountain Time)
Protected area
- Buxcel State Game Production Area
- Fort Pierre National Grassland (part)
Lakes[4]
- Sheriff Reservoir
Demographics
| Historical population | |||
|---|---|---|---|
| Census | Pop. | %± | |
| 1920 | 3,004 | — | |
| 1930 | 3,177 | 5.8% | |
| 1940 | 2,509 | −21.0% | |
| 1950 | 2,281 | −9.1% | |
| 1960 | 2,066 | −9.4% | |
| 1970 | 1,882 | −8.9% | |
| 1980 | 1,463 | −22.3% | |
| 1990 | 1,324 | −9.5% | |
| 2000 | 1,193 | −9.9% | |
| 2010 | 1,006 | −15.7% | |
| 2019 (est.) | 903 | [8] | −10.2% |
| US Decennial Census[9] 1790-1960[10] 1900-1990[11] 1990-2000[12] 2010-2018[1] | |||
2000 census
As of the 2000 United States Census,[13] there were 1,193 people, 509 households, and 327 families in the county. The population density was 1.2 people per square mile (0.5/km2). There were 614 housing units at an average density of 0.6 per square mile (0.2/km2). The racial makeup of the county was 95.81% White, 2.43% Native American, 0.08% Pacific Islander, 0.17% from other races, and 1.51% from two or more races. 0.34% of the population were Hispanic or Latino of any race.
There were 509 households, out of which 29.30% had children under the age of 18 living with them, 53.20% were married couples living together, 7.50% had a female householder with no husband present, and 35.60% were non-families. 33.20% of all households were made up of individuals, and 15.10% had someone living alone who was 65 years of age or older. The average household size was 2.34 and the average family size was 2.98.
The county population contained 26.20% under the age of 18, 6.20% from 18 to 24, 25.50% from 25 to 44, 23.90% from 45 to 64, and 18.20% who were 65 years of age or older. The median age was 41 years. For every 100 females there were 103.90 males. For every 100 females age 18 and over, there were 102.80 males.
The median income for a household in the county was $30,288, and the median income for a family was $37,500. Males had a median income of $23,289 versus $17,143 for females. The per capita income for the county was $15,896. About 11.90% of families and 15.80% of the population were below the poverty line, including 27.60% of those under age 18 and 7.10% of those age 65 or over.
2010 census
As of the 2010 United States Census, there were 1,006 people, 458 households, and 280 families in the county.[14] The population density was 1.0 inhabitant per square mile (0.39/km2). There were 589 housing units at an average density of 0.6 per square mile (0.23/km2).[15] The racial makeup of the county was 95.6% white, 2.0% American Indian, 0.4% Pacific islander, 0.1% black or African American, 0.0% from other races, and 1.9% from two or more races. Those of Hispanic or Latino origin made up 1.3% of the population.[14] In terms of ancestry, 48.8% were German, 15.9% were Irish, 10.2% were Norwegian, 9.0% were Dutch, and 1.9% were American.[16] In terms of ancestry in 2016, 39.1% were of German, 14.3% were of Irish, 13.9% were of Norwegian, 11.4% were of Dutch, 6.4% were of English, 6.2 were of French.
Of the 458 households, 26.6% had children under the age of 18 living with them, 53.7% were married couples living together, 5.2% had a female householder with no husband present, 38.9% were non-families, and 35.8% of all households were made up of individuals. The average household size was 2.20 and the average family size was 2.86. The median age was 46.9 years.[14]
The median income for a household in the county was $49,464 and the median income for a family was $56,589. Males had a median income of $33,021 versus $27,115 for females. The per capita income for the county was $24,630. About 6.6% of families and 9.1% of the population were below the poverty line, including 16.7% of those under age 18 and 8.4% of those age 65 or over.[17]
Communities
City
- Murdo (county seat)
Town
Census-designated place
Unincorporated community
Townships
- Buffalo
- Draper
- Dunkel
- Grandview
- Kolls
- Morga
- Mullen
- Mussman
- Okaton
- Scovil
- South Creek
- Williams Creek
- Zickrick
Unorganized territories
- Central Jones
- North Jones
- Rich Valley
- Westover
Politics
Jones County voters have been reliably Republican. The last Democrat to carry Jones County in a Presidential election was Lyndon Johnson in 1964, and Jimmy Carter in 1976 was the last to top one third of the county's ballots. Even before the Democratic Party turned towards its modern liberalism, Jones County did not vote for any Democrat except LBJ and Franklin D. Roosevelt in 1932 and 1936 – and in the latter election when Roosevelt won 46 of 48 states he beat Alf Landon in Jones County by just twelve votes.
| Year | Republican | Democratic | Third parties |
|---|---|---|---|
| 2016 | 80.7% 450 | 12.4% 69 | 7.0% 39 |
| 2012 | 80.5% 490 | 17.7% 108 | 1.8% 11 |
| 2008 | 73.8% 463 | 23.4% 147 | 2.7% 17 |
| 2004 | 78.8% 565 | 18.7% 134 | 2.5% 18 |
| 2000 | 76.7% 509 | 20.6% 137 | 2.7% 18 |
| 1996 | 63.5% 463 | 25.2% 184 | 11.3% 82 |
| 1992 | 58.3% 454 | 21.3% 166 | 20.4% 159 |
| 1988 | 66.3% 521 | 33.2% 261 | 0.5% 4 |
| 1984 | 76.6% 689 | 22.9% 206 | 0.4% 4 |
| 1980 | 75.0% 689 | 20.6% 189 | 4.5% 41 |
| 1976 | 57.9% 515 | 42.0% 374 | 0.1% 1 |
| 1972 | 64.4% 642 | 34.7% 346 | 0.9% 9 |
| 1968 | 55.8% 562 | 35.5% 358 | 8.7% 88 |
| 1964 | 43.1% 415 | 56.9% 548 | |
| 1960 | 60.4% 644 | 39.6% 423 | |
| 1956 | 56.1% 601 | 43.9% 471 | |
| 1952 | 69.6% 739 | 30.4% 323 | |
| 1948 | 55.1% 522 | 43.7% 414 | 1.3% 12 |
| 1944 | 63.8% 465 | 36.2% 264 | |
| 1940 | 62.1% 832 | 37.9% 508 | |
| 1936 | 48.1% 608 | 49.1% 620 | 2.9% 36 |
| 1932 | 32.4% 472 | 63.9% 929 | 3.7% 54 |
| 1928 | 66.4% 857 | 32.7% 422 | 0.9% 11 |
| 1924 | 55.5% 732 | 10.7% 141 | 33.9% 447 |
| 1920 | 62.3% 609 | 26.1% 255 | 11.6% 113 |
References
- "State & County QuickFacts". United States Census Bureau. Archived from the original on June 7, 2011. Retrieved November 25, 2013.
- "Find a County". National Association of Counties. Archived from the original on May 31, 2011. Retrieved June 7, 2011.
- "Dakota Territory, South Dakota, and North Dakota: Individual County Chronologies". Dakota Territory Atlas of Historical County Boundaries. The Newberry Library. 2006. Retrieved March 30, 2015.
- Jones County SD Google Maps (accessed 4 February 2019)
- ""Find an Altitude" Google Maps (accessed 4 February 2019)". Archived from the original on May 21, 2019. Retrieved February 5, 2019.
- "2010 Census Gazetteer Files". US Census Bureau. August 22, 2012. Retrieved March 26, 2015.
- Map of Time Zone Line through South Dakota (accessed January 30, 2019)
- "Annual Estimates of the Resident Population for Counties: April 1, 2010 to July 1, 2019". Retrieved April 10, 2020.
- "US Decennial Census". US Census Bureau. Retrieved March 26, 2015.
- "Historical Census Browser". University of Virginia Library. Retrieved March 26, 2015.
- Forstall, Richard L., ed. (March 27, 1995). "Population of Counties by Decennial Census: 1900 to 1990". US Census Bureau. Retrieved March 26, 2015.
- "Census 2000 PHC-T-4. Ranking Tables for Counties: 1990 and 2000" (PDF). US Census Bureau. April 2, 2001. Retrieved March 26, 2015.
- "U.S. Census website". US Census Bureau. Retrieved May 14, 2011.
- "Profile of General Population and Housing Characteristics: 2010 Demographic Profile Data". US Census Bureau. Archived from the original on February 13, 2020. Retrieved March 12, 2016.
- "Population, Housing Units, Area, and Density: 2010 - County". US Census Bureau. Archived from the original on February 13, 2020. Retrieved March 12, 2016.
- "Selected Social Characteristics in the US – 2006-2010 American Community Survey 5-Year Estimates". US Census Bureau. Archived from the original on February 13, 2020. Retrieved March 12, 2016.
- "Selected Economic Characteristics – 2006-2010 American Community Survey 5-Year Estimates". US Census Bureau. Archived from the original on February 13, 2020. Retrieved March 12, 2016.
- Leip, David. "Atlas of US Presidential Elections". uselectionatlas.org. Retrieved April 15, 2018.
Places adjacent to Jones County, South Dakota | ||||||||||
|---|---|---|---|---|---|---|---|---|---|---|
| ||||||||||
Municipalities and communities of Jones County, South Dakota, United States | ||
|---|---|---|
| City | | |
| Town | ||
| CDP | ||
| Unincorporated communities | ||
| Township | ||
| ||
