Hamlin County, South Dakota
Hamlin County is a county in the U.S. state of South Dakota. As of the 2010 United States Census, the population was 5,903.[1] Its county seat is Hayti.[2] The county was created in 1873 and organized in 1878.[3] It was named for Hannibal Hamlin, Lincoln's first vice-president.[4]
Hamlin County | |
|---|---|
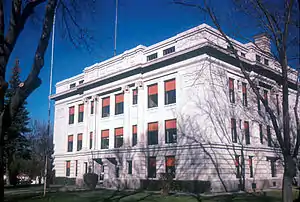 Hamlin County Courthouse in Hayti in 1974 | |
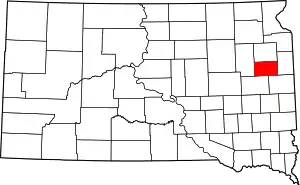 Location within the U.S. state of South Dakota | |
 South Dakota's location within the U.S. | |
| Coordinates: 44°41′N 97°12′W | |
| Country | |
| State | |
| Founded | 1873 (created 1878 (organized) |
| Named for | Hannibal Hamlin |
| Seat | Hayti |
| Largest city | Estelline |
| Area | |
| • Total | 538 sq mi (1,390 km2) |
| • Land | 507 sq mi (1,310 km2) |
| • Water | 31 sq mi (80 km2) 5.7% |
| Population (2010) | |
| • Total | 5,903 |
| • Estimate (2018) | 6,111 |
| • Density | 11/sq mi (4.2/km2) |
| Time zone | UTC−6 (Central) |
| • Summer (DST) | UTC−5 (CDT) |
| Congressional district | At-large |
Geography
The terrain of Hamlin County consists of low rolling hills, dotted with small lakes and ponds. The land is largely dedicated to agriculture.[5] The terrain slopes to the south-southeast, and its highest point is on the eastern boundary line, near its NE corner, at 1,949' (594m) ASL.[6]
Hamlin County has a total area of 538 square miles (1,390 km2), of which 507 square miles (1,310 km2) is land and 31 square miles (80 km2) (5.7%) is water.[7]
Major highways
Adjacent counties
- Codington County - north
- Deuel County - east
- Brookings County - southeast
- Kingsbury County - southwest
- Clark County - west
Protected areas[5]
- Baxter Slough State Public Shooting Area
- Bochek State Public Shooting Area
- Eidsness State Public Shooting Area
- Hamlin State Public Shooting Area
- Harju State Public Shooting Area
- Hayes Slough State Public Shooting Area
- Johnsons Slough State Public Shooting Area
- McShane State Public Shooting Area
- Opdahl Slough State Public Shooting Area
- Rasmussen State Public Shooting Area
Lakes[5]
- Clear Lake
- Dry Lake
- Lake Albert (partial)
- Lake Marsh
- Lake Mary
- Lake Poinsett
- Lake Saint John
Demographics
| Historical population | |||
|---|---|---|---|
| Census | Pop. | %± | |
| 1880 | 693 | — | |
| 1890 | 4,623 | 567.1% | |
| 1900 | 5,945 | 28.6% | |
| 1910 | 7,475 | 25.7% | |
| 1920 | 8,054 | 7.7% | |
| 1930 | 8,299 | 3.0% | |
| 1940 | 7,562 | −8.9% | |
| 1950 | 7,058 | −6.7% | |
| 1960 | 6,303 | −10.7% | |
| 1970 | 5,172 | −17.9% | |
| 1980 | 5,261 | 1.7% | |
| 1990 | 4,974 | −5.5% | |
| 2000 | 5,540 | 11.4% | |
| 2010 | 5,903 | 6.6% | |
| 2019 (est.) | 6,164 | [8] | 4.4% |
| US Decennial Census[9] 1790-1960[10] 1900-1990[11] 1990-2000[12] 2010-2018[1] | |||
2000 census
As of the 2000 United States Census,[13] there were 5,540 people, 2,048 households, and 1,452 families in the county. The population density was 11 people per square mile (4/km2). There were 2,626 housing units at an average density of 5 per square mile (2/km2). The racial makeup of the county was 98.48% White, 0.13% Black or African American, 0.58% Native American, 0.18% Asian, 0.11% from other races, and 0.52% from two or more races. 0.63% of the population were Hispanic or Latino of any race. 28.7% were of German, 21.8% Norwegian, 13.0% Finnish and 7.6% American ancestry, 95.2% spoke English, 2.6% German and 1.5% Spanish as their first language.
There were 2,048 households, out of which 33.80% had children under the age of 18 living with them, 63.50% were married couples living together, 4.80% had a female householder with no husband present, and 29.10% were non-families. 27.00% of all households were made up of individuals, and 14.50% had someone living alone who was 65 years of age or older. The average household size was 2.62 and the average family size was 3.22.
The county population contained 29.40% under the age of 18, 6.90% from 18 to 24, 24.00% from 25 to 44, 20.50% from 45 to 64, and 19.20% who were 65 years of age or older. The median age was 38 years. For every 100 females, there were 98.90 males. For every 100 females age 18 and over, there were 96.80 males.
The median income for a household in the county was $33,851, and the median income for a family was $41,511. Males had a median income of $28,446 versus $21,412 for females. The per capita income for the county was $16,982. About 7.20% of families and 12.10% of the population were below the poverty line, including 17.00% of those under age 18 and 14.30% of those age 65 or over.
2010 census
As of the 2010 United States Census, there were 5,903 people, 2,108 households, and 1,483 families in the county.[14] The population density was 11.6 inhabitants per square mile (4.5/km2). There were 2,760 housing units at an average density of 5.4 per square mile (2.1/km2).[15] The racial makeup of the county was 96.7% white, 0.3% American Indian, 0.2% black or African American, 0.2% Asian, 1.8% from other races, and 0.8% from two or more races. Those of Hispanic or Latino origin made up 2.5% of the population.[14] In terms of ancestry, 42.3% were German, 24.0% were Norwegian, 7.0% were English, 6.1% were Irish, 5.4% were Dutch, and 5.3% were American.[16]
Of the 2,108 households, 33.2% had children under the age of 18 living with them, 61.4% were married couples living together, 5.6% had a female householder with no husband present, 29.6% were non-families, and 25.6% of all households were made up of individuals. The average household size was 2.68 and the average family size was 3.28. The median age was 36.8 years.[14]
The median income for a household in the county was $44,439 and the median income for a family was $54,483. Males had a median income of $36,921 versus $24,645 for females. The per capita income for the county was $21,558. About 4.9% of families and 7.5% of the population were below the poverty line, including 11.5% of those under age 18 and 7.9% of those age 65 or over.[17]
Communities
Cities
Census-designated place
Townships
- Brantford
- Castlewood
- Cleveland
- Dempster
- Dixon
- Estelline
- Florence
- Garfield
- Hamlin
- Hayti
- Norden
- Opdahl
- Oxford
Politics
Hamlin County voters have usually voted Republican. In only one national election since 1932 has the county selected the Democratic Party candidate.
| Year | Republican | Democratic | Third parties |
|---|---|---|---|
| 2016 | 74.3% 2,051 | 20.1% 555 | 5.7% 156 |
| 2012 | 64.6% 1,803 | 33.0% 921 | 2.5% 69 |
| 2008 | 59.6% 1,661 | 37.4% 1,043 | 3.0% 83 |
| 2004 | 64.6% 1,946 | 33.7% 1,015 | 1.7% 50 |
| 2000 | 63.6% 1,731 | 33.9% 923 | 2.5% 69 |
| 1996 | 49.0% 1,352 | 39.9% 1,101 | 11.1% 305 |
| 1992 | 41.4% 1,133 | 30.2% 826 | 28.5% 781 |
| 1988 | 52.1% 1,380 | 47.5% 1,258 | 0.5% 13 |
| 1984 | 64.5% 1,782 | 34.9% 963 | 0.6% 16 |
| 1980 | 62.7% 1,885 | 30.0% 903 | 7.3% 219 |
| 1976 | 50.7% 1,452 | 48.9% 1,402 | 0.4% 12 |
| 1972 | 56.9% 1,693 | 42.9% 1,276 | 0.3% 9 |
| 1968 | 56.4% 1,649 | 39.3% 1,149 | 4.4% 128 |
| 1964 | 49.4% 1,525 | 50.6% 1,561 | |
| 1960 | 63.5% 2,139 | 36.5% 1,230 | |
| 1956 | 61.7% 2,083 | 38.3% 1,294 | |
| 1952 | 71.5% 2,391 | 28.5% 954 | |
| 1948 | 54.0% 1,608 | 44.5% 1,326 | 1.5% 45 |
| 1944 | 64.0% 1,811 | 36.0% 1,020 | |
| 1940 | 64.0% 2,279 | 36.0% 1,282 | |
| 1936 | 52.3% 1,857 | 45.6% 1,622 | 2.1% 75 |
| 1932 | 39.2% 1,267 | 59.4% 1,920 | 1.3% 43 |
| 1928 | 63.2% 1,959 | 35.1% 1,088 | 1.7% 53 |
| 1924 | 52.4% 1,144 | 9.5% 207 | 38.1% 833 |
| 1920 | 63.7% 1,322 | 16.2% 337 | 20.1% 417 |
| 1916 | 57.8% 1,039 | 38.5% 692 | 3.7% 66 |
| 1912 | 0.0% 0 | 29.9% 474 | 70.1% 1,110 |
| 1908 | 68.6% 1,095 | 27.2% 434 | 4.3% 68 |
| 1904 | 75.8% 1,197 | 19.4% 307 | 4.8% 76 |
| 1900 | 62.8% 928 | 34.4% 509 | 2.8% 41 |
| 1896 | 55.1% 702 | 43.9% 559 | 1.0% 13 |
| 1892 | 50.8% 537 | 15.2% 161 | 34.0% 359 |
References
- "State & County QuickFacts". United States Census Bureau. Archived from the original on June 7, 2011. Retrieved November 25, 2013.
- "Find a County". National Association of Counties. Retrieved 7 June 2011.
- "Dakota Territory, South Dakota, and North Dakota: Individual County Chronologies". Dakota Territory Atlas of Historical County Boundaries. The Newberry Library. 2006. Retrieved March 29, 2015.
- Gannett, Henry (1905). The Origin of Certain Place Names in the United States. Govt. Print. Off. p. 148.
- Hamlin County SD Google Maps (accessed 3 February 2019)
- ""Find an Altitude" Google Maps (accessed February 3, 2019)". Archived from the original on May 21, 2019. Retrieved February 3, 2019.
- "2010 Census Gazetteer Files". US Census Bureau. August 22, 2012. Retrieved March 26, 2015.
- "Annual Estimates of the Resident Population for Counties: April 1, 2010 to July 1, 2019". Retrieved April 10, 2020.
- "US Decennial Census". US Census Bureau. Retrieved March 26, 2015.
- "Historical Census Browser". University of Virginia Library. Retrieved March 26, 2015.
- Forstall, Richard L., ed. (March 27, 1995). "Population of Counties by Decennial Census: 1900 to 1990". US Census Bureau. Retrieved March 26, 2015.
- "Census 2000 PHC-T-4. Ranking Tables for Counties: 1990 and 2000" (PDF). US Census Bureau. April 2, 2001. Retrieved March 26, 2015.
- "U.S. Census website". US Census Bureau. Retrieved 14 May 2011.
- "Profile of General Population and Housing Characteristics: 2010 Demographic Profile Data". US Census Bureau. Archived from the original on 13 February 2020. Retrieved 12 March 2016.
- "Population, Housing Units, Area, and Density: 2010 - County". US Census Bureau. Archived from the original on 13 February 2020. Retrieved 12 March 2016.
- "Selected Social Characteristics in the US – 2006-2010 American Community Survey 5-Year Estimates". US Census Bureau. Archived from the original on 13 February 2020. Retrieved 12 March 2016.
- "Selected Economic Characteristics – 2006-2010 American Community Survey 5-Year Estimates". US Census Bureau. Archived from the original on 13 February 2020. Retrieved 12 March 2016.
- Leip, David. "Atlas of US Presidential Elections". uselectionatlas.org. Retrieved 15 April 2018.
Places adjacent to Hamlin County, South Dakota | ||||||||||
|---|---|---|---|---|---|---|---|---|---|---|
| ||||||||||
Municipalities and communities of Hamlin County, South Dakota, United States | ||
|---|---|---|
| Cities | | |
| Towns | ||
| CDP | ||
| Unincorporated communities | ||
| Footnotes | ‡This populated place also has portions in an adjacent county or counties | |
| ||

| Authority control |
|---|