Sanborn County, South Dakota
Sanborn County is a county in the U.S. state of South Dakota. As of the 2010 United States Census, the population was 2,355.[1] Its county seat and largest city is Woonsocket.[2] The county was created by the Dakota Territorial legislature on May 1, 1883 with land partitioned from Miner County. It was fully organized by July 18, 1883.[3]
Sanborn County | |
|---|---|
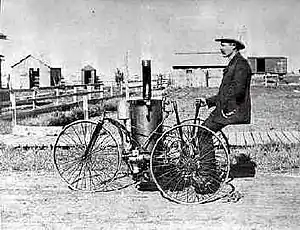 Steam-powered automobile by E.S. Callihan in Woodsocket (1884) | |
 Location within the U.S. state of South Dakota | |
 South Dakota's location within the U.S. | |
| Coordinates: 44°02′N 98°05′W | |
| Country | |
| State | |
| Founded | 1883 |
| Named for | George W. Sanborn |
| Seat | Woonsocket |
| Largest city | Woonsocket |
| Area | |
| • Total | 570 sq mi (1,500 km2) |
| • Land | 569 sq mi (1,470 km2) |
| • Water | 1.2 sq mi (3 km2) 0.2% |
| Population (2010) | |
| • Total | 2,355 |
| • Estimate (2018) | 2,429 |
| • Density | 4.1/sq mi (1.6/km2) |
| Time zone | UTC−6 (Central) |
| • Summer (DST) | UTC−5 (CDT) |
| Congressional district | At-large |
Geography
The terrain of Sanborn County consists of rolling hills, largely devoted to agriculture. The James River flows southward through the east-central part of the county, and the SW part of the country is drained by Dry Run Creek.[4] The terrain slopes to the south and to the southeast; its highest point is in its SW corner, at 1,358' (414m) ASL.[5] The county has a total area of 570 square miles (1,500 km2), of which 569 square miles (1,470 km2) is land and 1.2 square miles (3.1 km2) (0.2%) is water.[6]
Adjacent counties
- Beadle County - north
- Kingsbury County - northeast
- Miner County - east
- Hanson County - southeast
- Davison County - south
- Aurora County - southwest
- Jerauld County - west
Protected areas[4]
- McCoy Lake State Public Shooting Area
Lakes and reservoirs[4]
- Long Lake
- Twin Lakes (partial)
Demographics
| Historical population | |||
|---|---|---|---|
| Census | Pop. | %± | |
| 1890 | 4,610 | — | |
| 1900 | 4,464 | −3.2% | |
| 1910 | 6,607 | 48.0% | |
| 1920 | 7,877 | 19.2% | |
| 1930 | 7,326 | −7.0% | |
| 1940 | 5,754 | −21.5% | |
| 1950 | 5,142 | −10.6% | |
| 1960 | 4,641 | −9.7% | |
| 1970 | 3,697 | −20.3% | |
| 1980 | 3,213 | −13.1% | |
| 1990 | 2,833 | −11.8% | |
| 2000 | 2,675 | −5.6% | |
| 2010 | 2,355 | −12.0% | |
| 2019 (est.) | 2,344 | [7] | −0.5% |
| US Decennial Census[8] 1790-1960[9] 1900-1990[10] 1990-2000[11] 2010-2018[1] | |||
2000 census
As of the 2000 United States Census,[12] there were 2,675 people, 1,043 households, and 732 families in the county. The population density was 5 people per square mile (2/km2). There were 1,220 housing units at an average density of 2 per square mile (1/km2). The racial makeup of the county was 98.88% White, 0.04% Black or African American, 0.30% Native American, 0.37% Asian, 0.04% Pacific Islander, 0.11% from other races, and 0.26% from two or more races. 1.01% of the population were Hispanic or Latino of any race.
There were 1,043 households, out of which 30.30% had children under the age of 18 living with them, 61.50% were married couples living together, 4.90% had a female householder with no husband present, and 29.80% were non-families. 25.40% of all households were made up of individuals, and 12.70% had someone living alone who was 65 years of age or older. The average household size was 2.53 and the average family size was 3.07.
The county population contained 25.70% under the age of 18, 7.70% from 18 to 24, 23.70% from 25 to 44, 23.40% from 45 to 64, and 19.50% who were 65 years of age or older. The median age was 41 years. For every 100 females there were 107.20 males. For every 100 females age 18 and over, there were 104.70 males.
The median income for a household in the county was $33,375, and the median income for a family was $38,256. Males had a median income of $25,951 versus $18,482 for females. The per capita income for the county was $18,301. About 11.00% of families and 14.90% of the population were below the poverty line, including 22.10% of those under age 18 and 14.30% of those age 65 or over.
2010 census
As of the 2010 United States Census, there were 2,355 people, 975 households, and 630 families in the county.[13] The population density was 4.1 inhabitants per square mile (1.6/km2). There were 1,172 housing units at an average density of 2.1 per square mile (0.81/km2).[14] The racial makeup of the county was 98.0% white, 0.3% American Indian, 0.2% Asian, 0.6% from other races, and 1.1% from two or more races. Those of Hispanic or Latino origin made up 1.2% of the population.[13] In terms of ancestry,[15]
Of the 975 households, 24.2% had children under the age of 18 living with them, 55.0% were married couples living together, 6.3% had a female householder with no husband present, 35.4% were non-families, and 31.1% of all households were made up of individuals. The average household size was 2.24 and the average family size was 2.79. The median age was 47.1 years.[13]
The median income for a household in the county was $44,732 and the median income for a family was $56,304. Males had a median income of $32,361 versus $23,724 for females. The per capita income for the county was $21,055. About 7.7% of families and 12.7% of the population were below the poverty line, including 21.4% of those under age 18 and 15.1% of those age 65 or over.[16]
Communities
City
- Woonsocket (county seat)
Census-designated place
Unincorporated community
Townships
- Afton
- Benedict
- Butler
- Diana
- Elliott
- Floyd
- Jackson
- Letcher
- Logan
- Oneida
- Ravenna
- Silver Creek
- Twin Lake
- Union
- Warren
- Woonsocket
Politics
Sanborn County has been a swing state in the past, but in recent decades has tended to vote Republican. In 64% of the national elections since 1960, the county selected the Republican Party candidate (as of 2016).
| Year | Republican | Democratic | Third parties |
|---|---|---|---|
| 2016 | 72.9% 819 | 21.5% 241 | 5.6% 63 |
| 2012 | 61.7% 688 | 34.9% 389 | 3.4% 38 |
| 2008 | 55.4% 669 | 41.4% 500 | 3.2% 38 |
| 2004 | 57.3% 817 | 40.7% 581 | 2.0% 28 |
| 2000 | 60.5% 767 | 36.9% 468 | 2.6% 33 |
| 1996 | 43.8% 630 | 45.0% 647 | 11.2% 161 |
| 1992 | 37.0% 595 | 39.3% 632 | 23.8% 383 |
| 1988 | 51.1% 815 | 48.3% 770 | 0.6% 10 |
| 1984 | 63.7% 1,080 | 36.1% 611 | 0.2% 4 |
| 1980 | 61.0% 1,178 | 32.5% 628 | 6.5% 126 |
| 1976 | 46.1% 881 | 53.6% 1,025 | 0.3% 6 |
| 1972 | 49.6% 1,064 | 50.1% 1,074 | 0.3% 7 |
| 1968 | 49.7% 1,024 | 46.4% 956 | 3.9% 80 |
| 1964 | 39.4% 912 | 60.6% 1,401 | |
| 1960 | 50.1% 1,254 | 49.9% 1,249 | |
| 1956 | 50.5% 1,327 | 49.5% 1,302 | |
| 1952 | 66.1% 1,761 | 34.0% 905 | |
| 1948 | 48.0% 990 | 50.8% 1,046 | 1.2% 25 |
| 1944 | 54.8% 1,212 | 45.2% 998 | |
| 1940 | 55.3% 1,732 | 44.7% 1,398 | |
| 1936 | 36.6% 1,174 | 59.9% 1,919 | 3.5% 111 |
| 1932 | 26.2% 860 | 73.1% 2,398 | 0.7% 23 |
| 1928 | 54.1% 1,576 | 45.3% 1,321 | 0.6% 17 |
| 1924 | 47.3% 1,184 | 13.1% 327 | 39.6% 990 |
| 1920 | 49.9% 1,125 | 22.9% 517 | 27.2% 613 |
| 1916 | 42.0% 711 | 53.0% 898 | 5.0% 84 |
| 1912 | 0.0% 0 | 37.1% 577 | 62.9% 977 |
| 1908 | 57.7% 847 | 35.0% 513 | 7.4% 108 |
| 1904 | 74.1% 1,013 | 19.4% 265 | 6.6% 90 |
| 1900 | 51.6% 628 | 45.1% 549 | 3.4% 41 |
| 1896 | 50.7% 530 | 47.9% 500 | 1.4% 15 |
| 1892 | 55.6% 564 | 9.4% 95 | 35.0% 355 |
References
- "State & County QuickFacts". United States Census Bureau. Retrieved November 28, 2013.
- "Find a County". National Association of Counties. Retrieved June 7, 2011.
- History of SD Counties/Sanborn (accessed February 8, 2019)
- Sanborn County SD Google Maps (accessed 8 February 2019)
- ""Find an Altitude" Google Maps (accessed 8 February 2019)". Archived from the original on May 21, 2019. Retrieved February 8, 2019.
- "2010 Census Gazetteer Files". US Census Bureau. August 22, 2012. Retrieved March 28, 2015.
- "Annual Estimates of the Resident Population for Counties: April 1, 2010 to July 1, 2019". Retrieved April 10, 2020.
- "US Decennial Census". US Census Bureau. Retrieved March 28, 2015.
- "Historical Census Browser". University of Virginia Library. Retrieved March 28, 2015.
- Forstall, Richard L., ed. (March 27, 1995). "Population of Counties by Decennial Census: 1900 to 1990". US Census Bureau. Retrieved March 28, 2015.
- "Census 2000 PHC-T-4. Ranking Tables for Counties: 1990 and 2000" (PDF). US Census Bureau. April 2, 2001. Retrieved March 28, 2015.
- "U.S. Census website". US Census Bureau. Retrieved May 14, 2011.
- "Profile of General Population and Housing Characteristics: 2010 Demographic Profile Data". US Census Bureau. Archived from the original on February 13, 2020. Retrieved March 12, 2016.
- "Population, Housing Units, Area, and Density: 2010 - County". US Census Bureau. Archived from the original on February 13, 2020. Retrieved March 12, 2016.
- "Selected Social Characteristics in the US – 2006-2010 American Community Survey 5-Year Estimates". US Census Bureau. Archived from the original on February 13, 2020. Retrieved March 12, 2016.
- "Selected Economic Characteristics – 2006-2010 American Community Survey 5-Year Estimates". US Census Bureau. Archived from the original on February 13, 2020. Retrieved March 12, 2016.
- Leip, David. "Atlas of US Presidential Elections". uselectionatlas.org. Retrieved April 15, 2018.
Places adjacent to Sanborn County, South Dakota | ||||||||||
|---|---|---|---|---|---|---|---|---|---|---|
| ||||||||||
Municipalities and communities of Sanborn County, South Dakota, United States | ||
|---|---|---|
| City | | |
| Towns | ||
| Township | ||
| CDP | ||
| Other unincorporated community | ||
| ||

| Authority control |
|---|