McPherson County, South Dakota
McPherson County is a county in the U.S. state of South Dakota. As of the 2010 United States Census, the population was 2,459.[1] Its county seat is Leola.[2]
McPherson County | |
|---|---|
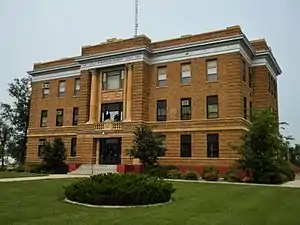 McPherson County Courthouse | |
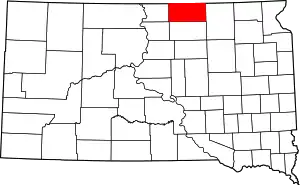 Location within the U.S. state of South Dakota | |
 South Dakota's location within the U.S. | |
| Coordinates: 45°46′N 99°13′W | |
| Country | |
| State | |
| Founded | 1873 (created) 1884 (organized) |
| Named for | James B. McPherson |
| Seat | Leola |
| Largest city | Eureka |
| Area | |
| • Total | 1,152 sq mi (2,980 km2) |
| • Land | 1,137 sq mi (2,940 km2) |
| • Water | 15 sq mi (40 km2) 1.3% |
| Population (2010) | |
| • Total | 2,459 |
| • Estimate (2018) | 2,407 |
| • Density | 2.1/sq mi (0.82/km2) |
| Time zone | UTC−6 (Central) |
| • Summer (DST) | UTC−5 (CDT) |
| Congressional district | At-large |
| Website | mcpherson |
History
The county was created in 1873 and organized in 1884.[3] It is named for American Civil War General James B. McPherson.[4]
Geography
McPherson County lies on the north line of South Dakota. The north boundary line of McPherson County abuts the south boundary line of the state of North Dakota. Its terrain consists of rolling hills, largely devoted to agriculture, and dotted with small lakes and ponds.[5] The terrain generally slopes to the south and east.[6] The county has a total area of 1,152 square miles (2,980 km2), of which 1,137 square miles (2,940 km2) is land and 15 square miles (39 km2) (1.3%) is water.[7]
The Samuel H. Ordway, Jr., Memorial Prairie, a 7,800-acre (3,200 ha) grassland owned by The Nature Conservancy on the south side of South Dakota Highway 10 about 10 miles (16 km) west of Leola, is home to a bison herd.[8][9]
Major highways
Adjacent counties
- McIntosh County, North Dakota - north
- Dickey County, North Dakota - northeast
- Brown County - east
- Edmunds County - south
- Walworth County - southwest
- Campbell County - west
Protected areas[5]
- Elm Lake State Game Production Area
- Moscow State Game Production Area
- Morlock State Game Production Area
- North Jackson State Game Production Area
- Odessa State Game Production Area
- Pfeiffle-Neuharth State Game Production Area
- Rath State Game Production Area
- Rosenthal State Game Production Area
- Schock State Game Production Area
- Schumacher State Game Production Area
- Simpson State Game Production Area
- School State Game Production Area
- South Jackson State Game Production Area
- Stout State Game Production Area
- Wageman State Game Production Area
- Wolff State Game Production Area
Lakes[5]
- Crompton Lake
- Elm Lake (partial)
- Eureka Lake
- Feinstein Lake
- Hausauer Lake
- Heufel Lake
- Klooz Lake
- Long Lake
Demographics
| Historical population | |||
|---|---|---|---|
| Census | Pop. | %± | |
| 1890 | 5,940 | — | |
| 1900 | 6,327 | 6.5% | |
| 1910 | 6,791 | 7.3% | |
| 1920 | 7,705 | 13.5% | |
| 1930 | 8,774 | 13.9% | |
| 1940 | 8,353 | −4.8% | |
| 1950 | 7,071 | −15.3% | |
| 1960 | 5,821 | −17.7% | |
| 1970 | 5,022 | −13.7% | |
| 1980 | 4,027 | −19.8% | |
| 1990 | 3,228 | −19.8% | |
| 2000 | 2,904 | −10.0% | |
| 2010 | 2,459 | −15.3% | |
| 2019 (est.) | 2,379 | [10] | −3.3% |
| US Decennial Census[11] 1790-1960[12] 1900-1990[13] 1990-2000[14] 2010-2018[1] | |||
2000 census
As of the 2000 United States Census,[15] there were 2,904 people, 1,227 households, and 822 families in the county. The population density was 3 people per square mile (1/km2). There were 1,465 housing units at an average density of 1.3 per square mile (0.5/km2). The racial makeup of the county was 99.35% White, 0.28% Native American, 0.14% Asian, 0.03% from other races, and 0.21% from two or more races. 0.21% of the population were Hispanic or Latino of any race.
There were 1,227 households, out of which 23.60% had children under the age of 18 living with them, 62.10% were married couples living together, 2.70% had a female householder with no husband present, and 33.00% were non-families. 31.10% of all households were made up of individuals, and 19.20% had someone living alone who was 65 years of age or older. The average household size was 2.31 and the average family size was 2.91.
The county population contained 22.20% under the age of 18, 4.50% from 18 to 24, 20.10% from 25 to 44, 23.60% from 45 to 64, and 29.60% who were 65 years of age or older. The median age was 48 years. For every 100 females there were 93.70 males. For every 100 females age 18 and over, there were 91.40 males.
The median income for a household in the county was $22,380, and the median income for a family was $29,811. Males had a median income of $23,705 versus $17,850 for females. The per capita income for the county was $12,748. About 17.00% of families and 22.60% of the population were below the poverty line, including 25.80% of those under age 18 and 22.20% of those age 65 or over.
2010 census
As of the 2010 census, there were 2,459 people, 1,025 households, and 632 families in the county.[16] The population density was 2.2 inhabitants per square mile (0.85/km2). There were 1,418 housing units at an average density of 1.2 per square mile (0.46/km2).[17] The racial makeup of the county was 98.2% white, 0.2% Asian, 0.1% Pacific islander, 0.2% from other races, and 1.3% from two or more races. Those of Hispanic or Latino origin made up 1.0% of the population.[16] In terms of ancestry, 74.5% were German, 17.7% were Russian, 7.3% were Norwegian, 6.7% were English, and 2.5% were American.[18]
Of the 1,025 households, 19.5% had children under the age of 18 living with them, 54.1% were married couples living together, 4.3% had a female householder with no husband present, 38.3% were non-families, and 36.3% of all households were made up of individuals. The average household size was 2.06 and the average family size was 2.66. The median age was 50.8 years.[16]
The median income for a household in the county was $31,923 and the median income for a family was $47,500. Males had a median income of $31,953 versus $27,941 for females. The per capita income for the county was $19,255. About 12.5% of families and 16.5% of the population were below the poverty line, including 21.3% of those under age 18 and 27.1% of those age 65 or over.[19]
Communities
Politics
Except during the 1924, 1928 and 1932 elections when anti-Prohibition sentiment by the county's German Lutheran populace turned the county against Calvin Coolidge and Herbert Hoover, McPherson County has been among the most overwhelmingly Republican in the country. Apart from these anomalous elections, the farm crisis-influenced elections of 1896 and 1956, and the 1936 Democratic landslide in the aftermath of Prohibition, the best performance by any Democrat has been Barack Obama’s 32 percent in 2008. In 1968[20] and 1980[21] McPherson was among the five most Republican counties in the country, and in 1964 it was rivalled only by neighbouring Campbell County and the famous Republican bastions of Hooker County, Nebraska and Jackson County, Kentucky as Barry Goldwater’s best county outside the former Confederacy.
| Year | Republican | Democratic | Third parties |
|---|---|---|---|
| 2016 | 78.5% 892 | 16.9% 192 | 4.7% 53 |
| 2012 | 75.8% 921 | 22.4% 272 | 1.8% 22 |
| 2008 | 66.6% 915 | 32.1% 441 | 1.4% 19 |
| 2004 | 74.7% 1,180 | 23.4% 369 | 1.9% 30 |
| 2000 | 75.7% 1,073 | 20.8% 295 | 3.5% 49 |
| 1996 | 62.3% 1,080 | 26.7% 463 | 11.1% 192 |
| 1992 | 53.9% 945 | 27.3% 478 | 18.8% 329 |
| 1988 | 70.1% 1,358 | 29.5% 571 | 0.4% 7 |
| 1984 | 81.1% 1,813 | 18.7% 418 | 0.2% 5 |
| 1980 | 85.6% 2,056 | 12.0% 287 | 2.5% 59 |
| 1976 | 70.2% 1,662 | 29.3% 693 | 0.5% 12 |
| 1972 | 76.9% 1,950 | 22.8% 579 | 0.2% 6 |
| 1968 | 80.3% 2,105 | 14.9% 389 | 4.8% 126 |
| 1964 | 72.3% 1,891 | 27.7% 723 | |
| 1960 | 79.3% 2,354 | 20.7% 616 | |
| 1956 | 50.1% 1,639 | 49.9% 1,635 | |
| 1952 | 87.0% 2,915 | 13.0% 436 | |
| 1948 | 76.2% 2,034 | 22.9% 611 | 0.9% 23 |
| 1944 | 84.8% 2,290 | 15.2% 410 | |
| 1940 | 77.5% 2,839 | 22.5% 826 | |
| 1936 | 54.8% 1,921 | 44.4% 1,556 | 0.8% 28 |
| 1932 | 18.4% 606 | 80.3% 2,650 | 1.4% 46 |
| 1928 | 45.5% 1,234 | 54.2% 1,468 | 0.3% 9 |
| 1924 | 28.8% 833 | 3.3% 94 | 67.9% 1,962 |
| 1920 | 72.9% 1,470 | 5.6% 112 | 21.5% 434 |
| 1916 | 80.1% 992 | 18.1% 224 | 1.9% 23 |
| 1912 | 32.9% 327 | 67.1% 668 | |
| 1908 | 81.9% 785 | 16.4% 157 | 1.8% 17 |
| 1904 | 77.8% 727 | 15.4% 144 | 6.8% 63 |
| 1900 | 74.2% 898 | 24.5% 297 | 1.3% 16 |
| 1896 | 58.3% 512 | 41.1% 361 | 0.7% 6 |
| 1892 | 50.5% 487 | 22.9% 221 | 26.6% 256 |
References
- "State & County QuickFacts". United States Census Bureau. Archived from the original on June 7, 2011. Retrieved November 25, 2013.
- "Find a County". National Association of Counties. Retrieved June 7, 2011.
- "Dakota Territory, South Dakota, and North Dakota: Individual County Chronologies". Dakota Territory Atlas of Historical County Boundaries. The Newberry Library. 2006. Retrieved March 30, 2015.
- Gannett, Henry (1905). The Origin of Certain Place Names in the United States. US Government Printing Office. p. 195.
- McPherson County SD Google Maps (accessed 6 February 2019)
- ""Find an Elevation" Google Maps (accessed 6 February 2019)". Archived from the original on May 21, 2019. Retrieved February 6, 2019.
- "2010 Census Gazetteer Files". US Census Bureau. August 22, 2012. Retrieved March 28, 2015.
- Grove, Noel (December 1988). "Quietly Conserving Nature". National Geographic. 174 (6): 841.
- "Samuel H. Ordway, Jr., Memorial Prairie". The Nature Conservancy. Retrieved May 13, 2015.
- "Annual Estimates of the Resident Population for Counties: April 1, 2010 to July 1, 2019". Retrieved April 10, 2020.
- "US Decennial Census". US Census Bureau. Retrieved March 28, 2015.
- "Historical Census Browser". University of Virginia Library. Retrieved March 28, 2015.
- Forstall, Richard L., ed. (March 27, 1995). "Population of Counties by Decennial Census: 1900 to 1990". US Census Bureau. Retrieved March 28, 2015.
- "Census 2000 PHC-T-4. Ranking Tables for Counties: 1990 and 2000" (PDF). US Census Bureau. April 2, 2001. Retrieved March 28, 2015.
- "U.S. Census website". US Census Bureau. Retrieved May 14, 2011.
- "Profile of General Population and Housing Characteristics: 2010 Demographic Profile Data". US Census Bureau. Archived from the original on February 13, 2020. Retrieved March 12, 2016.
- "Population, Housing Units, Area, and Density: 2010 - County". US Census Bureau. Archived from the original on February 13, 2020. Retrieved March 12, 2016.
- "Selected Social Characteristics in the US – 2006-2010 American Community Survey 5-Year Estimates". US Census Bureau. Archived from the original on February 13, 2020. Retrieved March 12, 2016.
- "Selected Economic Characteristics – 2006-2010 American Community Survey 5-Year Estimates". US Census Bureau. Archived from the original on February 13, 2020. Retrieved March 12, 2016.
- David Leip. "1968 Presidential Election Statistics". US Election Atlas. Retrieved March 27, 2018.
- David Leip. "1980 Presidential Election Statistics". US Election Atlas. Retrieved March 27, 2018.
- Leip, David. "Atlas of US Presidential Elections". uselectionatlas.org. Retrieved April 15, 2018.
Places adjacent to McPherson County, South Dakota | ||||||||||
|---|---|---|---|---|---|---|---|---|---|---|
| ||||||||||
Municipalities and communities of McPherson County, South Dakota, United States | ||
|---|---|---|
| Cities | | |
| Towns | ||
| Townships | ||
| Unincorporated community | ||
| ||

| Authority control |
|
|---|