Deuel County, South Dakota
Deuel County (/ˈduːl/ DOOL)[1] is a county in the U.S. state of South Dakota. As of the 2010 census, the population was 4,364.[2] Its county seat is Clear Lake.[3] The county was created in 1862, and was organized in 1878.[4] It is named for Jacob Deuel, a legislator in 1862.[5]
Deuel County | |
|---|---|
Deuel County Courthouse | |
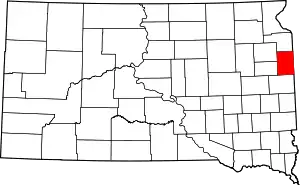 Location within the U.S. state of South Dakota | |
 South Dakota's location within the U.S. | |
| Coordinates: 44°46′N 96°40′W | |
| Country | |
| State | |
| Founded | 1862 (created) 1878 (organized) |
| Named for | Jacob Deuel |
| Seat | Clear Lake |
| Largest city | Clear Lake |
| Area | |
| • Total | 637 sq mi (1,650 km2) |
| • Land | 623 sq mi (1,610 km2) |
| • Water | 14 sq mi (40 km2) 2.2% |
| Population (2010) | |
| • Total | 4,364 |
| • Estimate (2018) | 4,337 |
| • Density | 6.9/sq mi (2.6/km2) |
| Time zone | UTC−6 (Central) |
| • Summer (DST) | UTC−5 (CDT) |
| Congressional district | At-large |
Geography
Deuel County lies on the east line of South Dakota. Its east boundary line abuts the west boundary line of the state of Minnesota. Its terrain consists of rolling hills, sloped to the northeast. The area is largely devoted to agriculture. The county's highest elevation occurs on its upper west boundary line, at 1,936' (590m) ASL.[6] The county has a total area of 637 square miles (1,650 km2), of which 623 square miles (1,610 km2) is land and 14 square miles (36 km2) (2.2%) is water.[7]
Major highways
Adjacent Counties
- Grant County - north
- Lac Qui Parle County, Minnesota - northeast
- Yellow Medicine County, Minnesota - east
- Lincoln County, Minnesota - southeast
- Brookings County - south
- Hamlin County - southwest
- Codington County - northwest
Lakes
- Bullhead Lake
- Clear Lake
- East Coteau Lake
- Fish Lake
- Lake Alice
- Lake Cochrane
- Lake Francis
- Lake Oliver
- Lone Tree Lake
- North Coteau Lake
- Round Lake
- Rush Lake
- Salt Lake (part)
- School Lake
- South Coteau Lake
- Wigdale Lake
Protected areas
- Altamont State Public Shooting Area[8]
- Astoria State Wildlife Management Area[9]
- Briggs Lake State Public Shooting Area[10]
- Crystal Springs State Public Shooting Area[11]
- Lake Cochrane State Recreation Area[12]
- Lake Francis State Public Shooting Area[13]
- Lone Tree Lake State Public Shooting Area[14]
- Mitchell State Public Shooting Area[15]
- Mud Lake State Public Shooting Area[16]
- Nelson State Wildlife Management Area[17]
- Rome State Wildlife Management Area[18]
- Round Lake State Wildlife Management Area[19]
- Runge State Wildlife Management Area[20]
- Rush Lake State Public Shooting Area[21]
- Sharp State Public Shooting Area[22]
- Singsaas Slough State Wildlife Management Area[23]
- Sokota State Wildlife Management Area (partial)[24]
Demographics
| Historical population | |||
|---|---|---|---|
| Census | Pop. | %± | |
| 1870 | 37 | — | |
| 1880 | 2,302 | 6,121.6% | |
| 1890 | 4,574 | 98.7% | |
| 1900 | 6,656 | 45.5% | |
| 1910 | 7,768 | 16.7% | |
| 1920 | 8,759 | 12.8% | |
| 1930 | 8,732 | −0.3% | |
| 1940 | 8,450 | −3.2% | |
| 1950 | 7,689 | −9.0% | |
| 1960 | 6,782 | −11.8% | |
| 1970 | 5,686 | −16.2% | |
| 1980 | 5,289 | −7.0% | |
| 1990 | 4,522 | −14.5% | |
| 2000 | 4,498 | −0.5% | |
| 2010 | 4,364 | −3.0% | |
| 2019 (est.) | 4,351 | [25] | −0.3% |
| US Decennial Census[26] 1790-1960[27] 1900-1990[28] 1990-2000[29] 2010-2018[2] | |||
2000 census
As of the 2000 United States Census,[30] there were 4,498 people, 1,843 households, and 1,258 families in the county. The population density was 7 people per square mile (3/km2). There were 2,172 housing units at an average density of 4 per square mile (1/km2). The racial makeup of the county was 98.51% White, 0.09% Black or African American, 0.29% Native American, 0.18% Asian, 0.02% Pacific Islander, 0.24% from other races, and 0.67% from two or more races. 0.76% of the population were Hispanic or Latino of any race. 46.9% were of German and 29.1% Norwegian ancestry.
There were 1,843 households, out of which 29.20% had children under the age of 18 living with them, 60.40% were married couples living together, 4.90% had a female householder with no husband present, and 31.70% were non-families. 28.60% of all households were made up of individuals, and 14.40% had someone living alone who was 65 years of age or older. The average household size was 2.40 and the average family size was 2.97.
The county population contained 25.30% under the age of 18, 5.90% from 18 to 24, 25.40% from 25 to 44, 22.60% from 45 to 64, and 20.70% who were 65 years of age or older. The median age was 41 years. For every 100 females there were 99.60 males. For every 100 females age 18 and over, there were 99.60 males.
The median income for a household in the county was $31,788, and the median income for a family was $39,511. Males had a median income of $26,306 versus $19,282 for females. The per capita income for the county was $15,977. About 6.90% of families and 10.30% of the population were below the poverty line, including 9.80% of those under age 18 and 16.70% of those age 65 or over.
2010 census
As of the 2010 United States Census, there were 4,364 people, 1,819 households, and 1,228 families in the county.[31] The population density was 7.0 inhabitants per square mile (2.7/km2). There were 2,204 housing units at an average density of 3.5 per square mile (1.4/km2).[32] The racial makeup of the county was 97.5% white, 0.3% American Indian, 0.3% black or African American, 0.1% Asian, 1.0% from other races, and 0.9% from two or more races. Those of Hispanic or Latino origin made up 2.0% of the population.[31] In terms of ancestry, 50.4% were German, 25.4% were Norwegian, 8.0% were Irish, 6.6% were Dutch, 5.5% were English, and 2.9% were American.[33]
Of the 1,819 households, 28.2% had children under the age of 18 living with them, 58.6% were married couples living together, 5.0% had a female householder with no husband present, 32.5% were non-families, and 29.1% of all households were made up of individuals. The average household size was 2.37 and the average family size was 2.92. The median age was 43.9 years.[31]
The median income for a household in the county was $47,000 and the median income for a family was $55,439. Males had a median income of $35,197 versus $26,020 for females. The per capita income for the county was $22,276. About 3.0% of families and 6.1% of the population were below the poverty line, including 5.6% of those under age 18 and 11.9% of those age 65 or over.[34]
Communities
Cities
- Clear Lake (county seat)
- Gary
Townships
- Altamont
- Antelope Valley
- Blom, Brandt
- Clear Lake
- Glenwood
- Goodwin
- Grange
- Havana
- Herrick
- Hidewood
- Lowe
- Norden
- Portland
- Rome
- Scandinavia
Politics
Deuel County is a typical eastern South Dakota county in its political history, which is somewhat akin to the Midwestern states of Iowa and Minnesota. It was strongly Republican in its early years, with no Democrat except William Jennings Bryan gaining forty percent up to 1928. Franklin D. Roosevelt in 1932 became the first Democrat to carry the county, but lost it to Alf Landon in 1936, whilst – like most of the Midwest – the county showed a powerful anti-Roosevelt trend in 1940 and 1944 due to opposition to World War II. From 1964, the county showed a strong trend towards the Democratic Party – so much so that it was one of only 130 counties nationwide to support South Dakota native George McGovern in 1972 against Richard Nixon, and one of only five nationwide to have supported both landslide losers Landon and McGovern.[lower-alpha 1]
Between 1976 and 2010, Deuel was a competitive swing county, voting for the winning candidate in every election until 2008 when Barack Obama lost by 34 votes. Over the past two elections, however, Deuel – in common with many rural counties nationwide – has shown an abrupt swing towards the Republican Party. Donald Trump’s 2016 win was the largest since Dwight D. Eisenhower in 1952.
| Year | Republican | Democratic | Third parties |
|---|---|---|---|
| 2016 | 65.7% 1,366 | 27.4% 570 | 6.9% 144 |
| 2012 | 54.1% 1,175 | 43.3% 941 | 2.5% 55 |
| 2008 | 49.1% 1,088 | 47.5% 1,054 | 3.4% 76 |
| 2004 | 58.3% 1,406 | 39.8% 961 | 1.9% 45 |
| 2000 | 56.0% 1,245 | 41.6% 926 | 2.4% 53 |
| 1996 | 40.7% 955 | 46.4% 1,090 | 12.9% 304 |
| 1992 | 32.1% 778 | 36.3% 880 | 31.6% 765 |
| 1988 | 49.5% 1,251 | 49.3% 1,246 | 1.2% 31 |
| 1984 | 61.7% 1,537 | 37.8% 941 | 0.5% 12 |
| 1980 | 60.4% 1,657 | 32.5% 891 | 7.1% 196 |
| 1976 | 44.4% 1,177 | 55.2% 1,465 | 0.4% 10 |
| 1972 | 49.6% 1,357 | 50.1% 1,370 | 0.3% 9 |
| 1968 | 53.3% 1,398 | 41.0% 1,076 | 5.8% 151 |
| 1964 | 46.4% 1,317 | 53.6% 1,524 | |
| 1960 | 61.9% 1,907 | 38.1% 1,173 | |
| 1956 | 55.5% 1,698 | 44.5% 1,363 | |
| 1952 | 72.2% 2,279 | 27.8% 879 | |
| 1948 | 49.9% 1,357 | 48.7% 1,324 | 1.4% 38 |
| 1944 | 61.8% 1,910 | 38.2% 1,180 | |
| 1940 | 66.4% 2,304 | 33.6% 1,166 | |
| 1936 | 50.6% 1,595 | 45.7% 1,440 | 3.7% 118 |
| 1932 | 40.2% 1,131 | 59.0% 1,658 | 0.8% 23 |
| 1928 | 64.4% 1,869 | 34.4% 999 | 1.2% 34 |
| 1924 | 60.3% 1,362 | 7.4% 168 | 32.2% 728 |
| 1920 | 70.0% 1,569 | 7.1% 159 | 23.0% 515 |
| 1916 | 59.4% 908 | 38.2% 584 | 2.5% 38 |
| 1912 | 31.2% 441 | 68.8% 974 | |
| 1908 | 64.8% 1,022 | 26.9% 425 | 8.3% 131 |
| 1904 | 80.3% 1,348 | 16.6% 279 | 3.0% 51 |
| 1900 | 62.8% 1,052 | 36.0% 604 | 1.2% 20 |
| 1896 | 51.0% 698 | 48.8% 668 | 0.3% 4 |
| 1892 | 43.8% 441 | 12.5% 126 | 43.7% 440 |
Notes
- The others are Middlesex and Norfolk in Massachusetts, Washtenaw County in Michigan, and Jackson County, Illinois.
References
- "Broadcast Pronunciation Guide and South Dakota Pronunciations". Associated Press. Archived from the original on 14 June 2011. Retrieved November 10, 2009.
- "State & County QuickFacts". United States Census Bureau. Archived from the original on June 7, 2011. Retrieved November 25, 2013.
- "Find a County". National Association of Counties. Archived from the original on May 31, 2011. Retrieved June 7, 2011.
- "Dakota Territory, South Dakota, and North Dakota: Individual County Chronologies". Dakota Territory Atlas of Historical County Boundaries. The Newberry Library. 2006. Retrieved March 29, 2015.
- Gannett, Henry (1905). The Origin of Certain Place Names in the United States. Govt. Print. Off. p. 105.
- ""Find an Altitude" Google Maps (accessed 2 February 2019)". Archived from the original on 21 May 2019. Retrieved 2 February 2019.
- "2010 Census Gazetteer Files". US Census Bureau. August 22, 2012. Retrieved March 24, 2015.
- Altamond State Public Shooting Areas, Clear Lake SD Google Maps (accessed 2 February 2019)
- Astoria State Wildlife Management Area, Astoria SD Google Maps (accessed 2 February 2019)
- Briggs Lake State Public Shooting Area, Gary SD Google Maps (accessed 2 February 2019)
- Crystal Springs State Public Shooting Area, Clear Lake SD Google Maps (accessed 2 February 2019)
- Lake Cochrane State Recreation Area Google Maps (accessed 2 February 2019)
- Lake Francis State Public Shooting Area Google Maps (accessed 2 February 2019)
- Lone Tree Lake State Public Shooting Area Google Maps (accessed 2 February 2019)
- Mitchell State Public Shooting Area, Revillo SD Google Maps (accessed 2 February 2019)
- Mud Lake State Public Shooting Area, Gary SD Google Maps (accessed 2 February 2019)
- Nelson State Wildlife Management Area, Clear Lake SD Google Maps (accessed 2 February 2019)
- Rome State Wildlife Management Area, Strandburg SD Google Maps (accessed 2 February 2019)
- Round Lake State Wildlife Management Area, Strandburg SD Google Maps (accessed 2 February 2019)
- Runge State Wildlife Management Area, Gary SD Google Maps (accessed 2 February 2019)
- Rush Lake State Public Shooting Area, Clear Lake SD Google Maps (accessed 2 February 2019)
- Sharp State Public Shooting Area, Clear Lake SD Google Maps (accessed 2 February 2019)
- Singsaas Slough State Wildlife Management Area, Astoria SD Google Maps (accessed 2 February 2019)
- Sokota State Wildlife Management Area, Hendricks MN Google Maps (accessed 2 February 2019)
- "Annual Estimates of the Resident Population for Counties: April 1, 2010 to July 1, 2019". Retrieved April 10, 2020.
- "US Decennial Census". US Census Bureau. Retrieved March 24, 2015.
- "Historical Census Browser". University of Virginia Library. Retrieved March 24, 2015.
- Forstall, Richard L., ed. (March 27, 1995). "Population of Counties by Decennial Census: 1900 to 1990". US Census Bureau. Retrieved March 24, 2015.
- "Census 2000 PHC-T-4. Ranking Tables for Counties: 1990 and 2000" (PDF). US Census Bureau. April 2, 2001. Retrieved March 24, 2015.
- "U.S. Census website". US Census Bureau. Retrieved May 14, 2011.
- "Profile of General Population and Housing Characteristics: 2010 Demographic Profile Data". US Census Bureau. Archived from the original on 13 February 2020. Retrieved 11 March 2016.
- "Population, Housing Units, Area, and Density: 2010 - County". US Census Bureau. Archived from the original on 13 February 2020. Retrieved 11 March 2016.
- "Selected Social Characteristics in the US – 2006-2010 American Community Survey 5-Year Estimates". US Census Bureau. Archived from the original on 13 February 2020. Retrieved 11 March 2016.
- "Selected Economic Characteristics – 2006-2010 American Community Survey 5-Year Estimates". US Census Bureau. Archived from the original on 13 February 2020. Retrieved 11 March 2016.
- Tunerville SD Google Maps (accessed 2 February 2019)
- Leip, David. "Atlas of US Presidential Elections". uselectionatlas.org. Retrieved 15 April 2018.
Places adjacent to Deuel County, South Dakota | |
|---|---|
Municipalities and communities of Deuel County, South Dakota, United States | ||
|---|---|---|
| Cities | | |
| Towns | ||
| Unincorporated communities | ||
| ||

| Authority control |
|---|